Hi all,
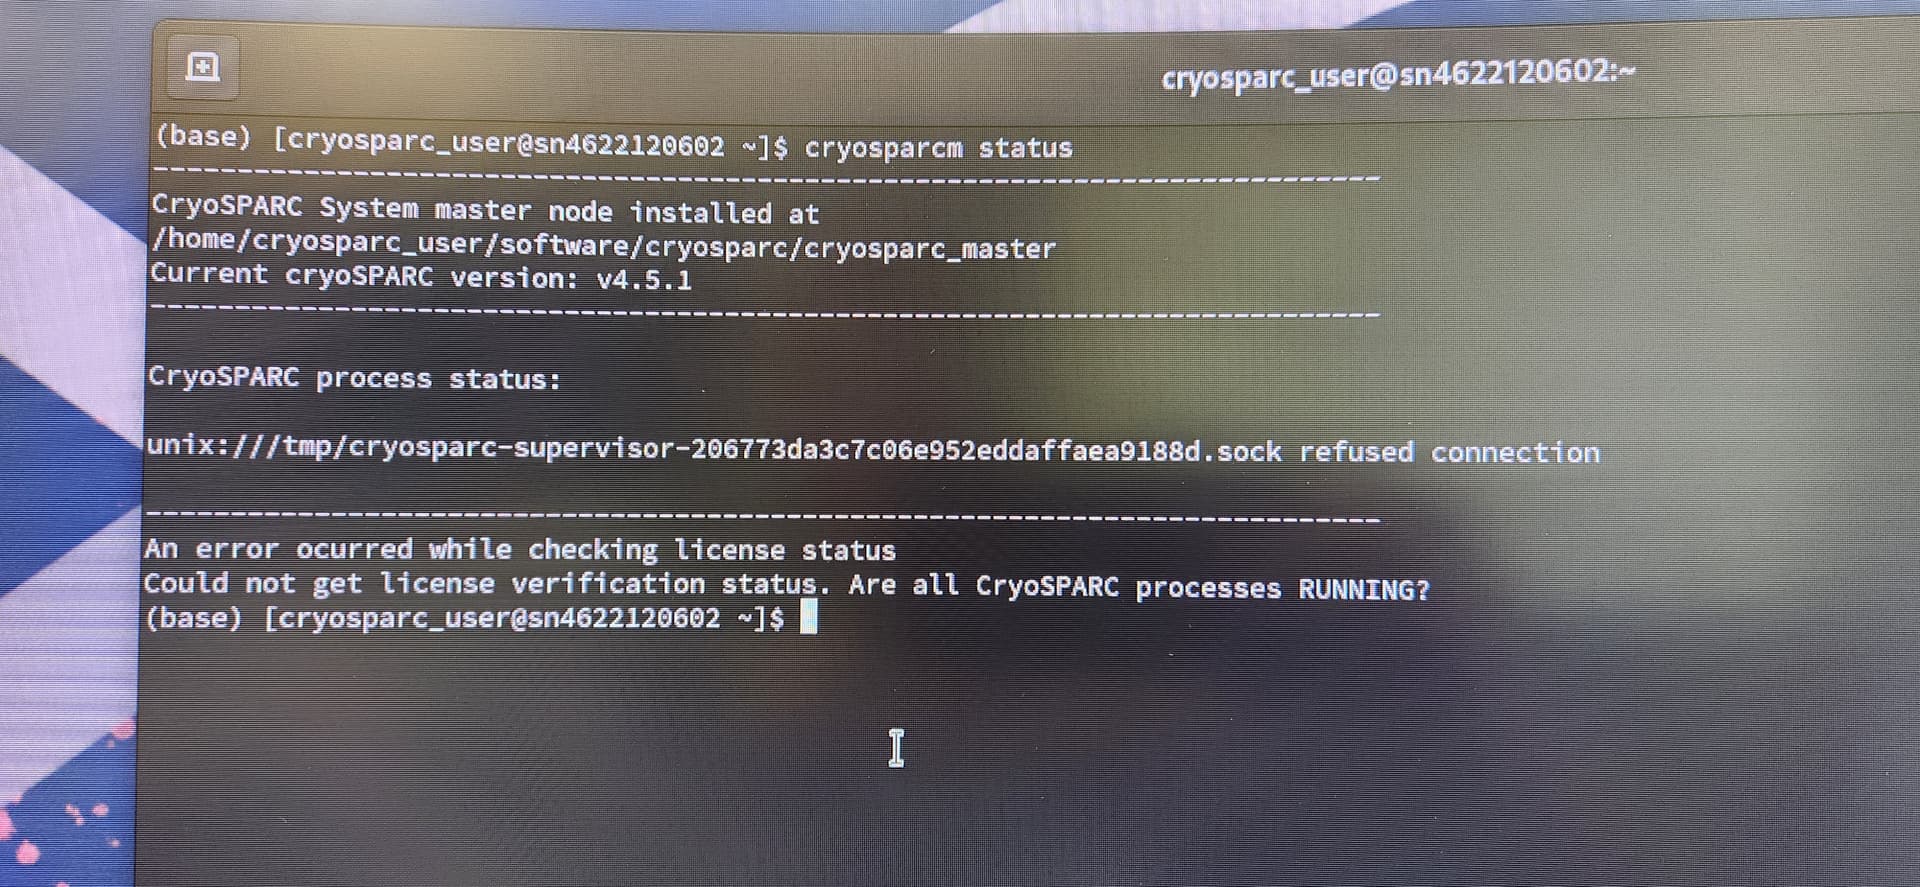
I am observing the same thing as mentioned previously by other users. Briefly, I have a new Dell workstation (4x NVIDIA A4500, 48 core (intel xeon w7), 256 Gb DDR5 Ram, 5T SSD, 118T HDD). I have two cryosparc users currently and I have opted for the ‘single workstation’ installation for each (which had previously worked well in my postdoc lab). However, I am routinely getting the ‘socket refused connection’ error when both users are running jobs. User 1 port = 39000 and user 2 port = 39020. We have intentionally only pushed the system to 50% capacity (GPUs are under 10Gb typically; RAM usually has >100 Gb free at any given moment). User 1 has sudo access and User 2 does not.
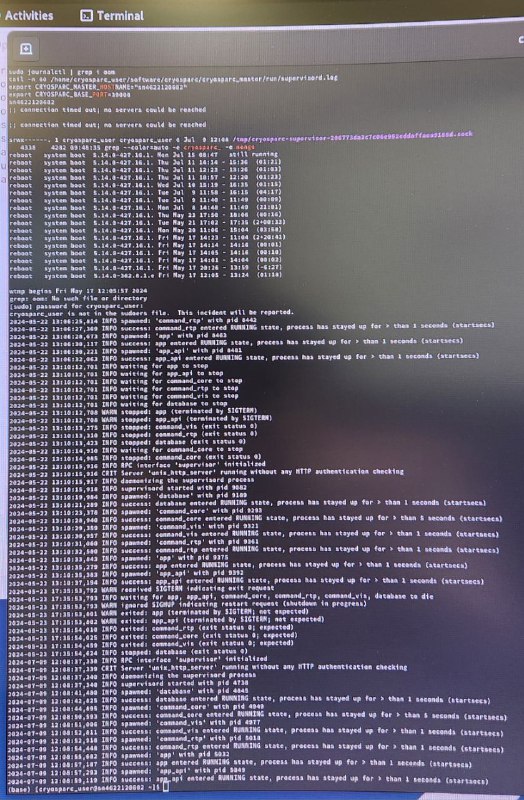
I ran this command from the comment thread and got this result:
grep -e HOST -e PORT /home/921270295@ad.sfsu.edu/.local/share/cryosparc/cryosparc_master/config.sh

hostname -f

host COSE-EGREENE-LX.clients.ad.sfsu.edu

host $(hostname -f)

ls -l /tmp/cryosparc*sock

ps -eo pid,ppid,start,command | grep -e cryosparc_ -e mongo

last reboot

tail -n 60 /home/921270295@ad.sfsu.edu/.local/share/cryosparc/cryosparc_master/run/supervisord.log

export CRYOSPARC_MASTER_HOSTNAME="COSE-EGREENE-LX.clients.ad.sfsu.edu"

export CRYOSPARC_BASE_PORT=39020

COSE-EGREENE-LX.clients.ad.sfsu.edu

COSE-EGREENE-LX.clients.ad.sfsu.edu has address 130.212.214.209

COSE-EGREENE-LX.clients.ad.sfsu.edu has IPv6 address fe80::6c41:9d2b:e7a9:d5d6

COSE-EGREENE-LX.clients.ad.sfsu.edu has address 130.212.214.209

COSE-EGREENE-LX.clients.ad.sfsu.edu has IPv6 address fe80::6c41:9d2b:e7a9:d5d6

srwx------ 1 921270295@ad.sfsu.edu domain users@ad.sfsu.edu 0 Jul 15 11:42 /tmp/cryosparc-supervisor-714ae7c340d4df77be474f8627fd6c9c.sock

1120743 85729 11:42:12 python /home/921270295@ad.sfsu.edu/.local/share/cryosparc/cryosparc_master/deps/anaconda/envs/cryosparc_master_env/bin/supervisord -c /home/921270295@ad.sfsu.edu/.local/share/cryosparc/cryosparc_master/supervisord.conf

1120879 1120743 11:42:16 mongod --auth --dbpath /home/921270295@ad.sfsu.edu/.local/share/cryosparc/cryosparc_database --port 39021 --oplogSize 64 --replSet meteor --wiredTigerCacheSizeGB 4 --bind_ip_all

1120994 1120743 11:42:20 python /home/921270295@ad.sfsu.edu/.local/share/cryosparc/cryosparc_master/deps/anaconda/envs/cryosparc_master_env/bin/gunicorn -n command_core -b 0.0.0.0:39022 cryosparc_command.command_core:start() -c /home/921270295@ad.sfsu.edu/.local/share/cryosparc/cryosparc_master/gunicorn.conf.py

1120995 1120994 11:42:20 python /home/921270295@ad.sfsu.edu/.local/share/cryosparc/cryosparc_master/deps/anaconda/envs/cryosparc_master_env/bin/gunicorn -n command_core -b 0.0.0.0:39022 cryosparc_command.command_core:start() -c /home/921270295@ad.sfsu.edu/.local/share/cryosparc/cryosparc_master/gunicorn.conf.py

1121024 1120743 11:42:26 python /home/921270295@ad.sfsu.edu/.local/share/cryosparc/cryosparc_master/deps/anaconda/envs/cryosparc_master_env/bin/gunicorn cryosparc_command.command_vis:app -n command_vis -b 0.0.0.0:39023 -c /home/921270295@ad.sfsu.edu/.local/share/cryosparc/cryosparc_master/gunicorn.conf.py

1121039 1121024 11:42:26 python /home/921270295@ad.sfsu.edu/.local/share/cryosparc/cryosparc_master/deps/anaconda/envs/cryosparc_master_env/bin/gunicorn cryosparc_command.command_vis:app -n command_vis -b 0.0.0.0:39023 -c /home/921270295@ad.sfsu.edu/.local/share/cryosparc/cryosparc_master/gunicorn.conf.py

1121048 1120743 11:42:27 python /home/921270295@ad.sfsu.edu/.local/share/cryosparc/cryosparc_master/deps/anaconda/envs/cryosparc_master_env/bin/gunicorn cryosparc_command.command_rtp:start() -n command_rtp -b 0.0.0.0:39025 -c /home/921270295@ad.sfsu.edu/.local/share/cryosparc/cryosparc_master/gunicorn.conf.py

1121060 1121048 11:42:27 python /home/921270295@ad.sfsu.edu/.local/share/cryosparc/cryosparc_master/deps/anaconda/envs/cryosparc_master_env/bin/gunicorn cryosparc_command.command_rtp:start() -n command_rtp -b 0.0.0.0:39025 -c /home/921270295@ad.sfsu.edu/.local/share/cryosparc/cryosparc_master/gunicorn.conf.py

1121094 1120743 11:42:31 /home/921270295@ad.sfsu.edu/.local/share/cryosparc/cryosparc_master/cryosparc_app/nodejs/bin/node ./bundle/main.js

1122908 1120995 11:51:01 bash /home/921270295@ad.sfsu.edu/.local/share/cryosparc/cryosparc_worker/bin/cryosparcw run --project P2 --job J29 --master_hostname COSE-EGREENE-LX.clients.ad.sfsu.edu --master_command_core_port 39022

1122918 1122908 11:51:01 python -c import cryosparc_compute.run as run; run.run() --project P2 --job J29 --master_hostname COSE-EGREENE-LX.clients.ad.sfsu.edu --master_command_core_port 39022

1122921 1122918 11:51:01 python -c import cryosparc_compute.run as run; run.run() --project P2 --job J29 --master_hostname COSE-EGREENE-LX.clients.ad.sfsu.edu --master_command_core_port 39022

1122945 1120995 11:51:04 bash /home/921270295@ad.sfsu.edu/.local/share/cryosparc/cryosparc_worker/bin/cryosparcw run --project P2 --job J30 --master_hostname COSE-EGREENE-LX.clients.ad.sfsu.edu --master_command_core_port 39022

1122955 1122945 11:51:04 python -c import cryosparc_compute.run as run; run.run() --project P2 --job J30 --master_hostname COSE-EGREENE-LX.clients.ad.sfsu.edu --master_command_core_port 39022

1122957 1122955 11:51:04 python -c import cryosparc_compute.run as run; run.run() --project P2 --job J30 --master_hostname COSE-EGREENE-LX.clients.ad.sfsu.edu --master_command_core_port 39022

1125517 1124882 12:08:52 grep --color=auto -e cryosparc_ -e mongo

reboot system boot 6.5.0-41-generic Tue Jul 2 12:04 still running

reboot system boot 6.5.0-41-generic Mon Jul 1 13:38 still running

reboot system boot 6.5.0-41-generic Thu Jun 27 11:18 still running

reboot system boot 6.5.0-35-generic Mon Jun 10 10:32 still running

reboot system boot 6.5.0-35-generic Wed Jun 5 14:51 still running

reboot system boot 6.5.0-35-generic Wed Jun 5 14:22 - 14:31 (00:08)

reboot system boot 6.5.0-35-generic Wed Jun 5 09:52 - 14:31 (04:38)

reboot system boot 6.5.0-35-generic Mon Jun 3 18:00 - 14:31 (1+20:30)

reboot system boot 6.5.0-35-generic Mon Jun 3 14:06 - 17:54 (03:47)

reboot system boot 6.5.0-28-generic Wed May 1 13:29 - 17:54 (33+04:24)

reboot system boot 6.5.0-28-generic Thu Apr 25 08:53 - 13:27 (6+04:33)

reboot system boot 6.5.0-28-generic Wed Apr 24 09:22 - 08:49 (23:27)

reboot system boot 6.5.0-27-generic Tue Apr 16 11:27 - 09:09 (7+21:42)

reboot system boot 6.5.0-26-generic Wed Apr 3 12:53 - 08:47 (7+19:54)

reboot system boot 6.5.0-26-generic Wed Mar 27 17:40 - 12:40 (6+18:59)

reboot system boot 6.5.0-26-generic Thu Mar 21 10:21 - 14:46 (6+04:24)

reboot system boot 6.5.0-26-generic Wed Mar 20 14:58 - 15:05 (00:06)

reboot system boot 6.5.0-26-generic Wed Mar 20 13:52 - 13:54 (00:01)

reboot system boot 6.5.0-26-generic Wed Mar 20 13:05 - 13:50 (00:45)

reboot system boot 6.5.0-26-generic Wed Mar 20 12:59 - 13:04 (00:04)

reboot system boot 6.5.0-26-generic Wed Mar 20 12:36 - 12:58 (00:22)

reboot system boot 6.5.0-26-generic Tue Mar 19 15:19 - 12:35 (21:15)

wtmp begins Tue Mar 19 15:19:43 2024

2024-07-10 17:30:36,938 CRIT Server 'unix_http_server' running without any HTTP authentication checking

2024-07-10 17:30:36,941 INFO daemonizing the supervisord process

2024-07-10 17:30:36,942 INFO supervisord started with pid 710428

2024-07-10 17:30:41,479 INFO spawned: 'database' with pid 710536

2024-07-10 17:30:42,674 INFO success: database entered RUNNING state, process has stayed up for > than 1 seconds (startsecs)

2024-07-10 17:30:44,904 INFO spawned: 'command_core' with pid 710644

2024-07-10 17:30:50,557 INFO success: command_core entered RUNNING state, process has stayed up for > than 5 seconds (startsecs)

2024-07-10 17:30:51,078 INFO spawned: 'command_vis' with pid 710677

2024-07-10 17:30:52,799 INFO success: command_vis entered RUNNING state, process has stayed up for > than 1 seconds (startsecs)

2024-07-10 17:30:52,952 INFO spawned: 'command_rtp' with pid 710706

2024-07-10 17:30:54,609 INFO success: command_rtp entered RUNNING state, process has stayed up for > than 1 seconds (startsecs)

2024-07-10 17:30:55,969 INFO spawned: 'app' with pid 710720

2024-07-10 17:30:57,436 INFO success: app entered RUNNING state, process has stayed up for > than 1 seconds (startsecs)

2024-07-10 17:30:57,553 INFO spawned: 'app_api' with pid 710740

2024-07-10 17:30:59,356 INFO success: app_api entered RUNNING state, process has stayed up for > than 1 seconds (startsecs)

2024-07-12 13:56:34,780 INFO waiting for app to stop

2024-07-12 13:56:34,780 INFO waiting for app_api to stop

2024-07-12 13:56:34,780 INFO waiting for command_core to stop

2024-07-12 13:56:34,780 INFO waiting for command_rtp to stop

2024-07-12 13:56:34,780 INFO waiting for command_vis to stop

2024-07-12 13:56:34,780 INFO waiting for database to stop

2024-07-12 13:56:34,799 WARN stopped: app (terminated by SIGTERM)

2024-07-12 13:56:34,802 WARN stopped: app_api (terminated by SIGTERM)

2024-07-12 13:56:35,132 INFO stopped: database (exit status 0)

2024-07-12 13:56:35,486 INFO stopped: command_vis (exit status 0)

2024-07-12 13:56:35,487 INFO stopped: command_rtp (exit status 0)

2024-07-12 13:56:37,086 INFO waiting for command_core to stop

2024-07-12 13:56:37,186 INFO stopped: command_core (exit status 0)

2024-07-12 14:29:56,282 INFO RPC interface 'supervisor' initialized

2024-07-12 14:29:56,282 CRIT Server 'unix_http_server' running without any HTTP authentication checking

2024-07-12 14:29:56,284 INFO daemonizing the supervisord process

2024-07-12 14:29:56,285 INFO supervisord started with pid 875815

2024-07-12 14:30:00,554 INFO spawned: 'database' with pid 875922

2024-07-12 14:30:02,090 INFO success: database entered RUNNING state, process has stayed up for > than 1 seconds (startsecs)

2024-07-12 14:30:03,728 INFO spawned: 'command_core' with pid 876030

2024-07-12 14:30:09,326 INFO success: command_core entered RUNNING state, process has stayed up for > than 5 seconds (startsecs)

2024-07-12 14:30:09,784 INFO spawned: 'command_vis' with pid 876100

2024-07-12 14:30:11,531 INFO success: command_vis entered RUNNING state, process has stayed up for > than 1 seconds (startsecs)

2024-07-12 14:30:11,653 INFO spawned: 'command_rtp' with pid 876131

2024-07-12 14:30:13,274 INFO success: command_rtp entered RUNNING state, process has stayed up for > than 1 seconds (startsecs)

2024-07-12 14:30:14,728 INFO spawned: 'app' with pid 876183

2024-07-12 14:30:16,233 INFO success: app entered RUNNING state, process has stayed up for > than 1 seconds (startsecs)

2024-07-12 14:30:16,365 INFO spawned: 'app_api' with pid 876204

2024-07-12 14:30:17,367 INFO success: app_api entered RUNNING state, process has stayed up for > than 1 seconds (startsecs)

2024-07-15 11:42:12,511 INFO RPC interface 'supervisor' initialized

2024-07-15 11:42:12,511 CRIT Server 'unix_http_server' running without any HTTP authentication checking

2024-07-15 11:42:12,513 INFO daemonizing the supervisord process

2024-07-15 11:42:12,514 INFO supervisord started with pid 1120743

2024-07-15 11:42:16,712 INFO spawned: 'database' with pid 1120879

2024-07-15 11:42:18,319 INFO success: database entered RUNNING state, process has stayed up for > than 1 seconds (startsecs)

2024-07-15 11:42:20,410 INFO spawned: 'command_core' with pid 1120994

2024-07-15 11:42:26,033 INFO success: command_core entered RUNNING state, process has stayed up for > than 5 seconds (startsecs)

2024-07-15 11:42:26,446 INFO spawned: 'command_vis' with pid 1121024

2024-07-15 11:42:27,446 INFO success: command_vis entered RUNNING state, process has stayed up for > than 1 seconds (startsecs)

2024-07-15 11:42:27,571 INFO spawned: 'command_rtp' with pid 1121048

2024-07-15 11:42:29,116 INFO success: command_rtp entered RUNNING state, process has stayed up for > than 1 seconds (startsecs)

2024-07-15 11:42:30,185 INFO spawned: 'app' with pid 1121073

2024-07-15 11:42:31,660 INFO success: app entered RUNNING state, process has stayed up for > than 1 seconds (startsecs)

2024-07-15 11:42:31,767 INFO spawned: 'app_api' with pid 1121094

2024-07-15 11:42:33,727 INFO success: app_api entered RUNNING state, process has stayed up for > than 1 seconds (startsecs)
We get the socket refusal after running homogeneous refinement jobs which fail at different times. We are now trying to just get one dataset analyzed at a time but, of course, would like to increase throughput. Any advice is greatly appreciated! Thank you!!