How does the new “cluster” mode in 3D variability display work? Does it cluster separately in each mode, or somehow cluster considering all modes at once?
For classification purposes I think one might want to cluster on the results of one specific mode - e.g. to separate closed from open channels while not considering unrelated variability. Is this possible?
3D var clustering (in the 3D var display job) is really straightforward right now - it loads in the reaction coordinates (position of each particle along each mode) computed by 3D Var, and then fits a simple mixture of gaussians to the coordinates (in all dimensions simultaneously). The number of gaussians in the mixture is equal to the number of clusters you specify.
Then the particles from each cluster are reconstructed separately and outputted.
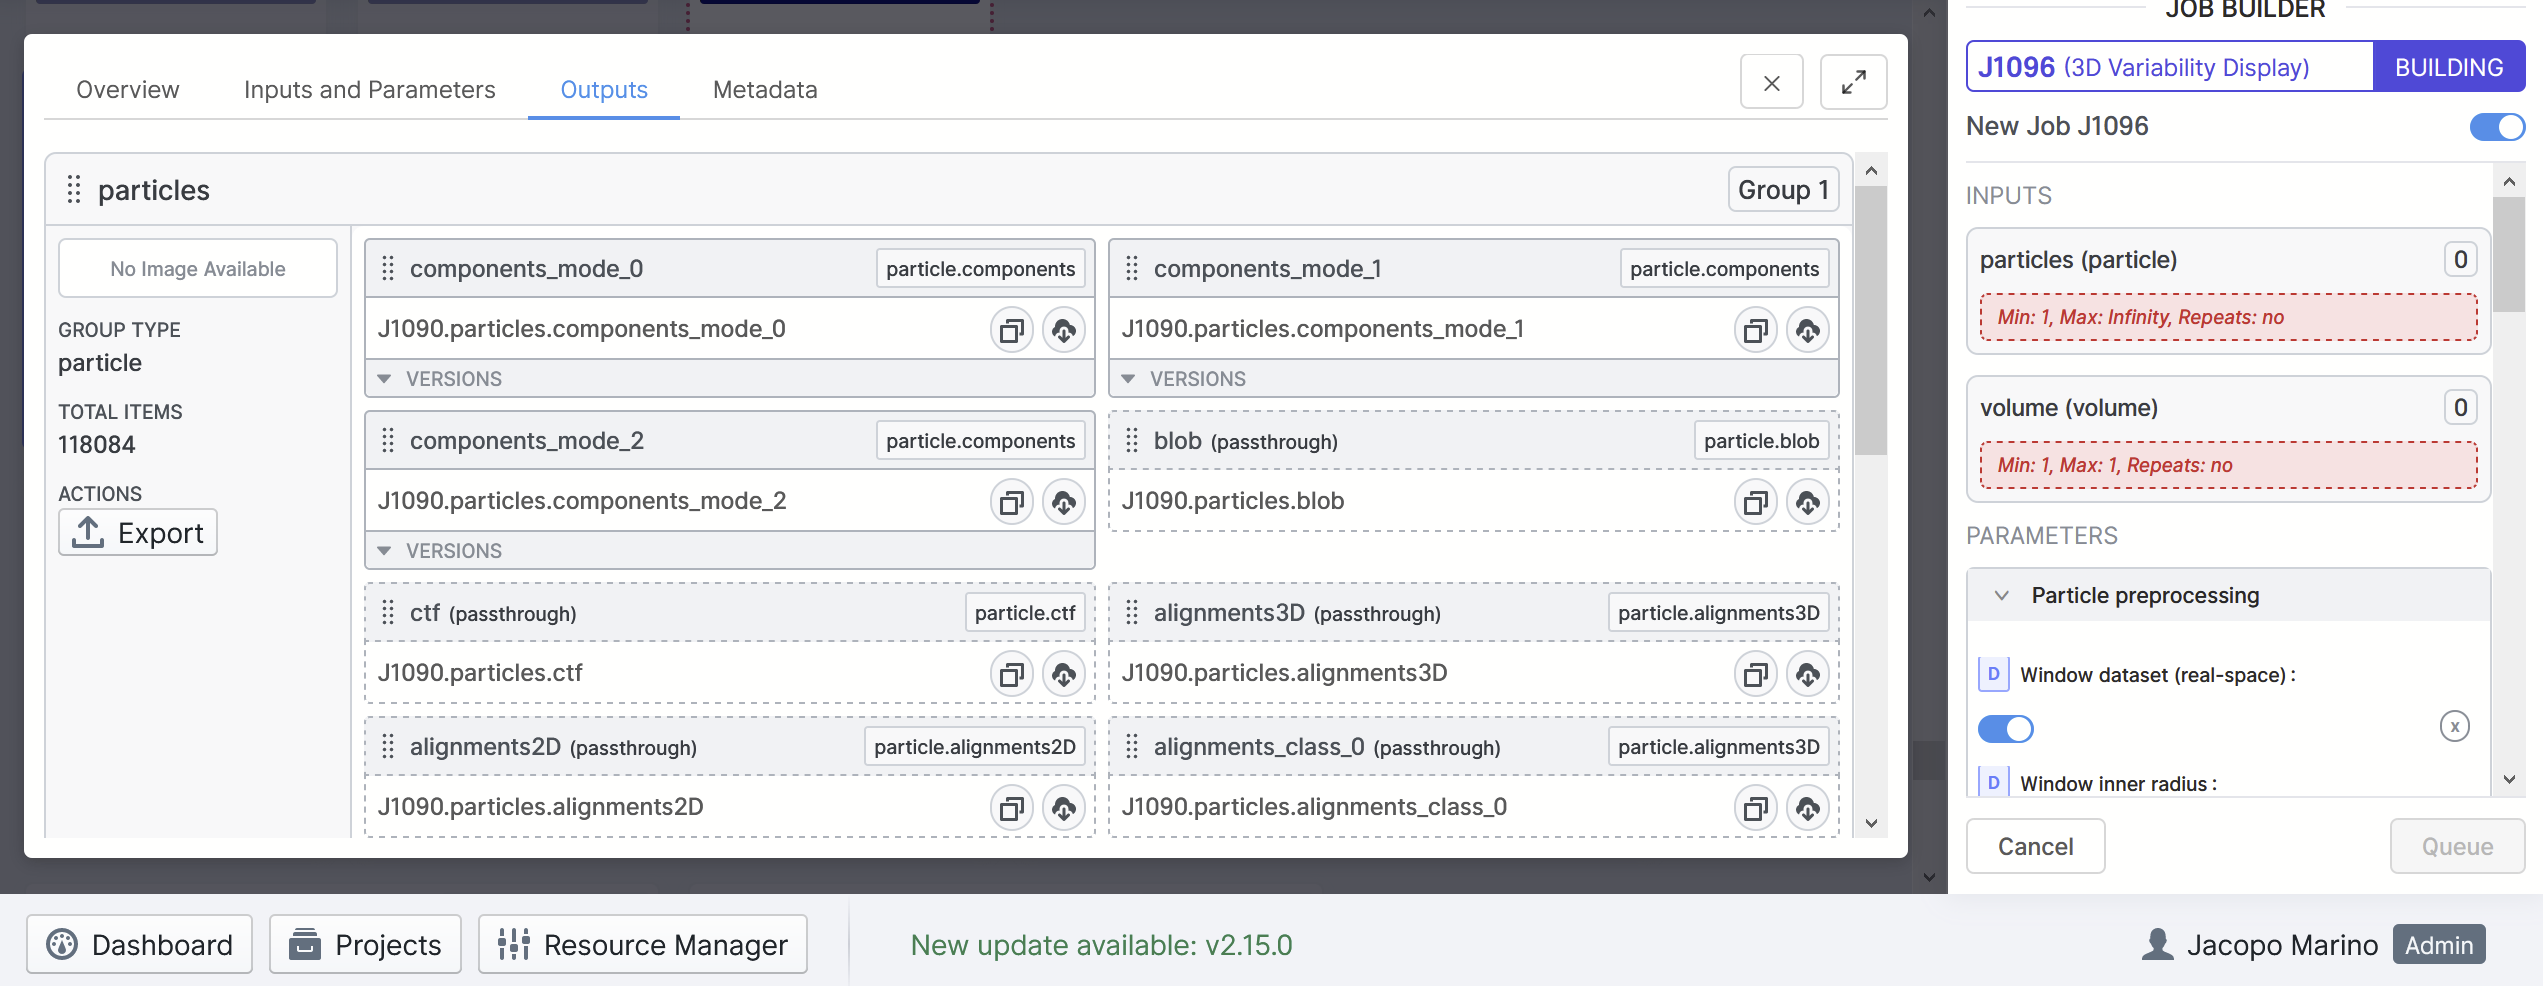
You can select which components you want to use for display/clustering by changing the inputs to the 3D var display job. You have to use the “low level results” view in the job builder and the “outputs” tab from the 3D var job.
From the particles, first disconnect all the “components_mode_X” inputs (except components_mode_0 which is required). Then from the 3D var job outputs tab, find the particles components_mode_X outputs that you do want to consider, and start connecting those instead. The first one you connect should be used to override the “compontents_mode_0” input.
Repeat the same process for the volume input (making sure to use the same component numbers for particles and volume).
Unfortunately you will have to consider at least 2 modes (rather than just one) for now, otherwise the display job will fail.
Other than the above, it is still always possible to read out and use the reaction coords from any dimension directly by looking at the .cs file output from 3D var. In that way you could create clusters in any strategy that makes sense.
One thing that I’ve found so far in limited experiments is that completely discrete separable clusters only really appear with relatively large discrete changes in a protein conformation, usually association/dissociation of subunits or really large discrete changes in position of some mass. In more common cases with smaller proteins or with more continuous motion, the distribution of particles along 3D var modes is pretty much continuous. So it might turn out that the simple clustering that is currently being done isn’t the best possible approach - but this is all still work in progress!
One other thing @apunjani - would it be possible to have the “intermediate” mode of 3D variability display output the corresponding particle sets as well, as cluster mode does? This would allow easy separation along a single reaction coordinate for further refinement, if I understand correctly what it is doing here. And I guess these particle sets are already being created for the intermediate reconstructions.
Also, right now the intermediate mode only allows overlapping ranges for each reconstruction - if I set the rolling window parameter to 0 it fails. Would it be possible to allow non overlapping ranges? So that I can calculate reconstructions or perform further refinements on say the top, middle, and bottom thirds along a particular reaction coordinate?
I’ve tried the low level results approach and it works - and it is possible to trick it into separating on one mode, by selecting the same mode twice in the low level results. This way it effectively clusters in only one dimension. Would still be great to be able to select particles with a user defined range for a given component - this would be helpful in the case where the distribution is continuous, not discrete, but the user would like to continue processing of a subset at either end of the conformational spread.
Hi @apunjani@olibclarke,
could you help me a bit, and post some screenshots to show what you mean by the description below, as I could not find the “low level results”, and I also do not understand what it means to “disconnect”…
More specifically I did 3D variability analyisis on a channel, I have 3 modes in the analysis. I see in the movies open and closing of the channel ( I do simple output in variability display). Now, I would like to segregate particles to the two main states, however when I choose cluster mode with 2 clusters, the volumes I get are nearly identical, thus not representing the extremes of the frames ( say frame 1, and frame 19) from the simple variability display job. With two clusters and with 120000 particles to start with, I get one cluster with 80k and other one with 30k, but as I said before the two volumes are identical.
Dear @olibclarke, thank you for your answer. I had a look at the page you indicate, but I did not find what anything that would lead me to understand what you and @apunjani describe . I truly do not know where these things are in cryosparc, or maybe I simply do not have them in my version ?
Here is what I see in output of a 3D variability job, while on the side there is a job building for the variability display:
Could you also give me some advice for my specific purpose ? I see in the movies output of the “simple” variability display job, a great deal of movement within the ion channel I analyze, and I think it oscillates between two states. Now, I would like to get individual maps of these two states, ideally at the higher res possible. If I do a variability display job with “intermediate” and I specify only 2 modes, I get nearly identical volumes, thus this approach does not work for what I need. Interestingly hetero refinement never captured these two states, thus 3D variability is a interesting approach to get to these results.
hi @olibclarke, thank you. I have obviously read all of it but can’t make it in my cryosparc, for example I do not see anywhere written “required” on my job building window on the left side (as in the picture I showed above). What is more, it does not allow me to drag and drop the tabs from the output window of a 3D variability analysis, into the input for the 3D variability display. I think it is really a point of not understanding the terminology used here:
You have to use the “low level results” view in the job builder . How do you do that ?
disconnect all the “components_mode_X” inputs (except components_mode_0 which is required). Then from the 3D var job outputs tab, find the particles components_mode_X outputs that you do want to consider, and start connecting those instead. How do you disconnect and where ?
I would be very glad if someone from cryosparc could advice any strategy for the specific problem I descibed above, as 3D variability display with “cluster mode” and two components did not help to obtain refined volumes of the extreme changes I see in the movies I obtain after simple mode. Many many thanks for your help !!