Dear cryosparc users,
I have a brief question about the cluster mode in 3D variability display. In the interactive “Clustered Scatter Plot” it shows very nicely how cryosparc clusters your particles according to the 3DVA. But in the plots legend the “clusters” are not called clusters, but “traces”.
In my case I have a reconstructed map of cluster000 e.g. that shows me, that I would like to exclude the particles of this specific cluster for further processing. But when I look at the interactive 3D plot, I am pretty sure that trace 0 does not represent the particles of my cluster000.
Can I check somewhere which trace represents which cluster or is it actually supposed to be trace number = cluster number?
Many thanks in advance 
I have the same issue. Definitely clusters and traces are not the same, and it would be VERY helpful if they were.
maybe someone from cryosparc team can comment on this? @spunjani
Has no one responded to this? Is there an answer elsewhere?
Apologies for the delayed response! We just looked into this – indeed, ‘traces’ are supposed to map 1-to-1 to clusters, but currently the legend in the interactive plot can be out of order from the job.
We’ll fix this in an upcoming release – each set of points will be labeled as ‘Cluster X’ and we’ll ensure it does indeed correspond to the Xth cluster! Thanks for catching this.
Valentin
2 Likes
Much appreciated!
Jennifer
Related to this problem but for simpler cases. The 2D and 1D clustering plots (for 3DVA display jobs looking at only 2 or 1 modes) do not contain any figure legend. Is this by design or can the legend be found somewhere? How are the clusters assigned in these cases?
Thanks!
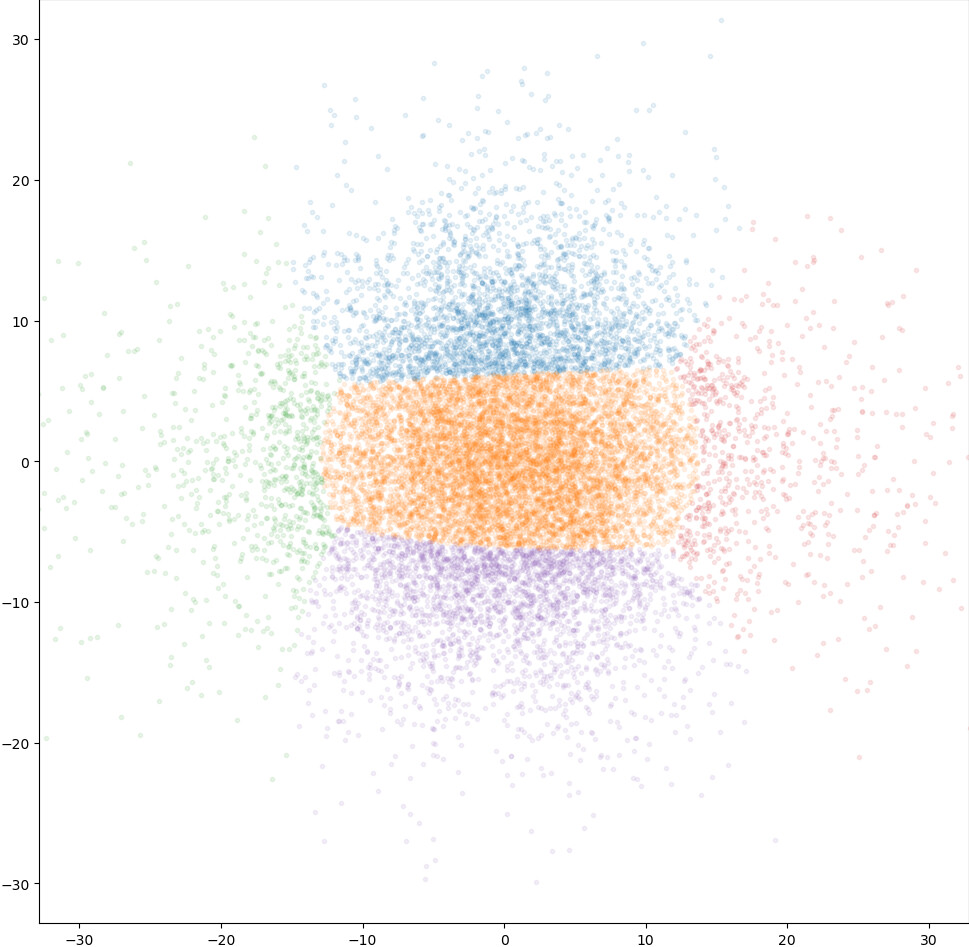
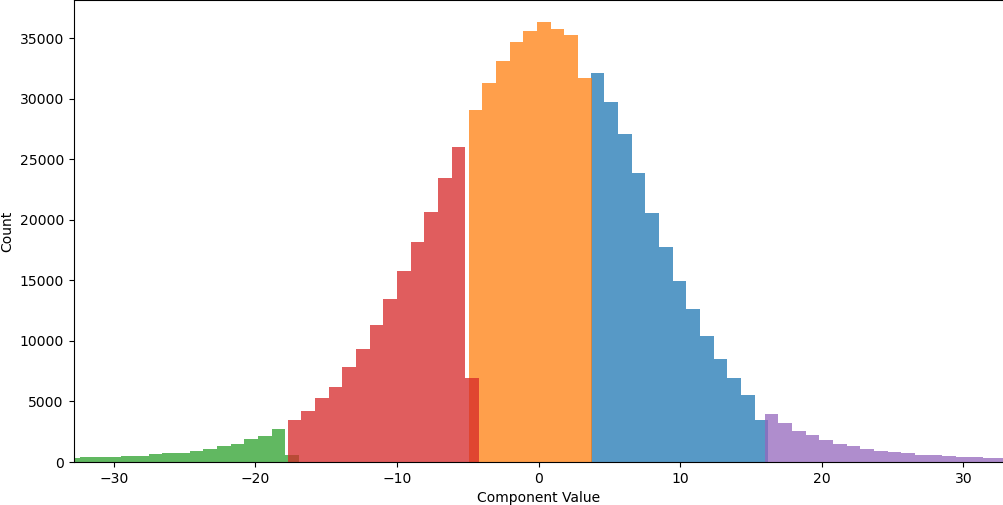
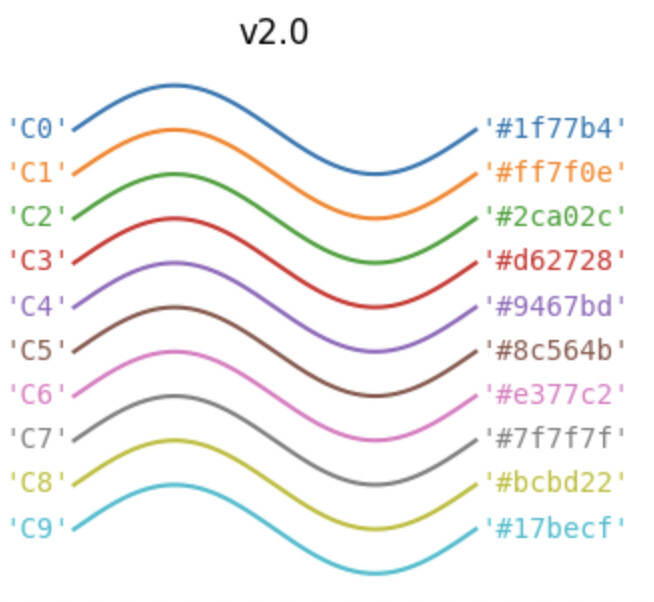
@ybloch ah, good catch! This is not very clear right now. The nth colour in the histograms corresponds to the nth cluster with the order set by the standard matplotlib cycle (blue, orange, green, red, etc):
This means that in 1D, the first cluster is not necessarily the one with the lowest component values. We’ll be sure to add a legend to these plots in an upcoming release to make this explicit.
2 Likes
Has anyone found a workaround for the cluster/trace issue? I don’t see an answer here to the original question if there is a way to check which trace represents which cluster. If someone has a way they have been addressing this issue we would love to hear about it.
Another thanks in advance!
Hi! We have a fix for this in the pipeline :). For now, a possible workaround is to import the particle .cs file (e.g., in a jupyter notebook) for each cluster, and manually determine where it lives in latent space by plotting components_mode_XX/value in that particular dataset (this tutorial has more info on working with .cs files: Tutorial: Manipulating .cs Files Created By cryoSPARC - CryoSPARC Guide).
Valentin
1 Like
A relevant patch has just been released.