I have encountered a new issue in step 15. After performing a Non-Uniform Refinement, the map quality, reported resolution, FSC curves, and orientation diagnostics have not improved. Where might I have gone wrong? Please help me, thank you very much!
Dynamic mask start resolution (A) 1 no mask for use
Hi @Amelia-LEMON !
Thanks for your query about the EMPIAR-10668 case study.
Step 15 involves particle subtraction to exclude density from neighbouring proteins, followed by re-running NU-refinement including minimisation over per-particle scale, and Global CTF refinement. In our hands, particle subtraction slightly improved the particle alignment and therefore map quality, FSC curve and cFAR.
To help us understand why you do not see an improvement at this stage it would be really helpful if you could you provide us with the following:
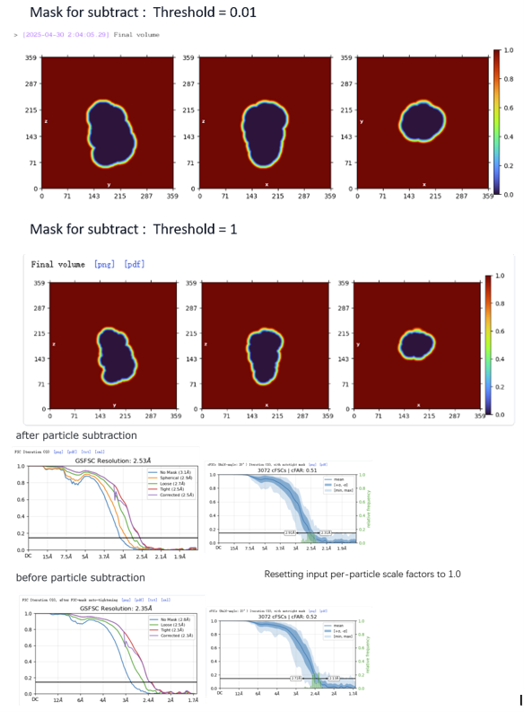
- An image of the subtraction mask used at a threshold of 0 and 1 (similar to the view in Figure 15) or real space slices from your particle subtraction job
- The plots for final GSFSC curves and summary of conical FSCs from the NU-refinements before and after particle subtraction.
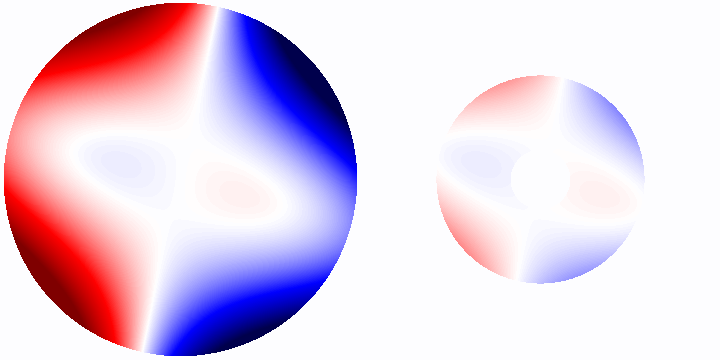
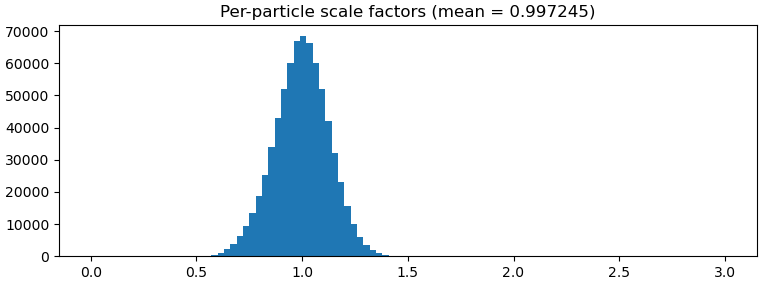
3.The plots for per-particle scale factors and the final fits for odd and even CTF terms from the NU-refinement after particle subtraction.
These plots from CryoSPARC can be downloaded as .png and added to a reply here.
It would also be useful to know how many particles you have in these refinements for comparison, and confirm the list of non-default settings used in the refinement after subtraction.
Hopefully that will be enough to help us troubleshoot!
Thank you very much for your reply! I have provided the information as follows, but I am unsure about the third point (I couldn’t find the relevant details on the NU-refinement results page). I look forward to your further guidance!
Hi @Amelia-LEMON! Thanks for providing those plots.
As a recap, the pertinent steps in this case study are:
12) NU refine with mask start resolution: 1 (refinement 5) we got 2.36 Å cFAR 0.63
13) re-center on the ECD, re-extract with a larger box and NU refine with mask start resolution: 1 optimize per group CTF params: true and Fit trefoil: false (refinement 6) we got 2.53 Å, cFAR 0.58
14) RBMC (optional) and NU refinement (refinement 7) we got 2.47 cFAR 0.53
15) particle subtract to remove signal from neighbouring particles and NU refine withmask start resolution: 1, Minimize over per-particle scale: true, optimize per group CTF params: true and Fit trefoil: true Fit Spherical Aberration: true (refinement 8) we got 2.42 Å cFAR 0.65.
We observed a drop in reported resolution between steps 12 and 13 and this may be partly due to more generous fsc_auto masking in refinement 6, but we saw better ECD density. Our FSC and cFAR improved between steps 14 and 15 but the map quality was not dramatically improved. When there are a lot of particles involved (~700k in our case), improving particle alignment by particle subtraction may not always give a clear effect on the consensus map, but it could still affect downstream analyses such as 3D Variability Analyses and Local Refinement.
So after all of that preamble, back to your enquiry about why your resolution, cFAR and map quality did not improve between steps 13/14 and 15!
- Can you confirm that the supplied plots came from refinement 6 and not refinement 5? 2.35 Å is a higher resolution than we observed for refinement 6.
- Did you run the optional RBMC (step 14) and did you include global CTF refinement of Spherical Aberration and Trefoil in refinement 8? If RBMC (step 14) was skipped, fitting spherical aberration and trefoil in step 15 might worsen the final resolution, and a better result might be obtained without refining these parameters so it would be worth checking the log to see if the resolution got worse in the last few iterations when global CTF refinement is included.
The plots for per-particle scale and global CTF fits can be found in the event log, but you will need to select the penultimate checkpoint from the top menu and scroll down to find them. Here are some example plots from our refinement 8, it would be helpful to use to compare these to your results.
Thanks for your reply!
Sorry, i supplied the wrong picture, it’s refinement 5. For the refinement 6, I got 2.52 Å and cFAR 0.51. I did’t run RBMC. I find that every refinement, the cFCR is always very low. Hovering around 0.5.