Hello,
In some recent work I came across some interesting behavior in 3dva. In this project, we were interested in studying the variability of particles at different orientations. We performed 3dva on our dataset and were looking at how the component statistics vary among particles in a given range of orientations. We found that the standard deviation of the particle component values varies significantly depending on which orientation the particles belong to, which has a direct impact on how we interpret the distribution of a given component.
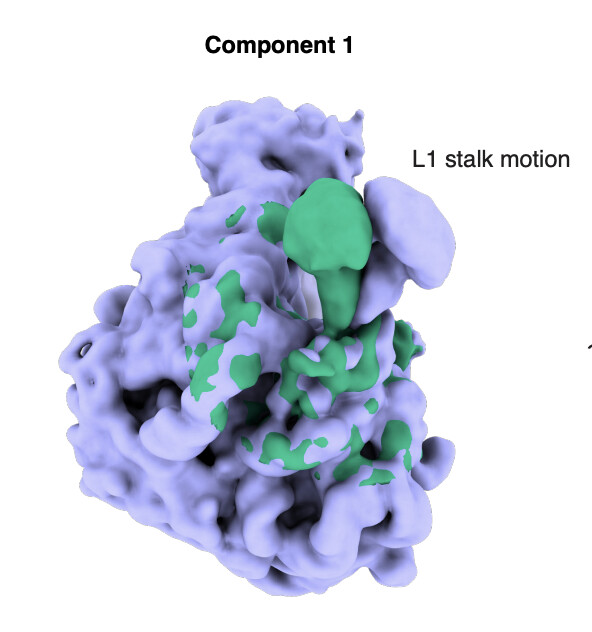
In our current example we are studying the flexible motions of the L1 stalk on the 50S ribosomal subunit.
After 3dva, and using CryoSPARC tools, we have found the following particle subset width versus angular distribution plot. This is generated by taking particles within a small window of a given pose and calculating the standard deviation of this this subset (doing this for each pose).
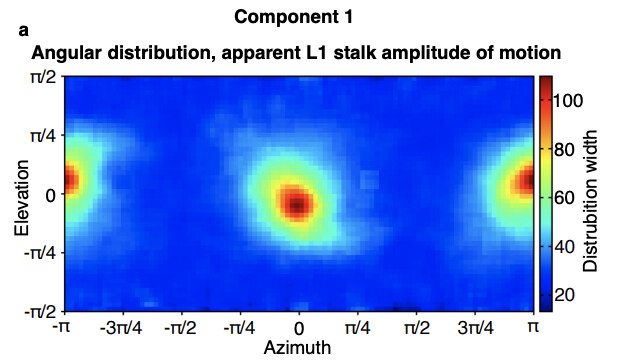
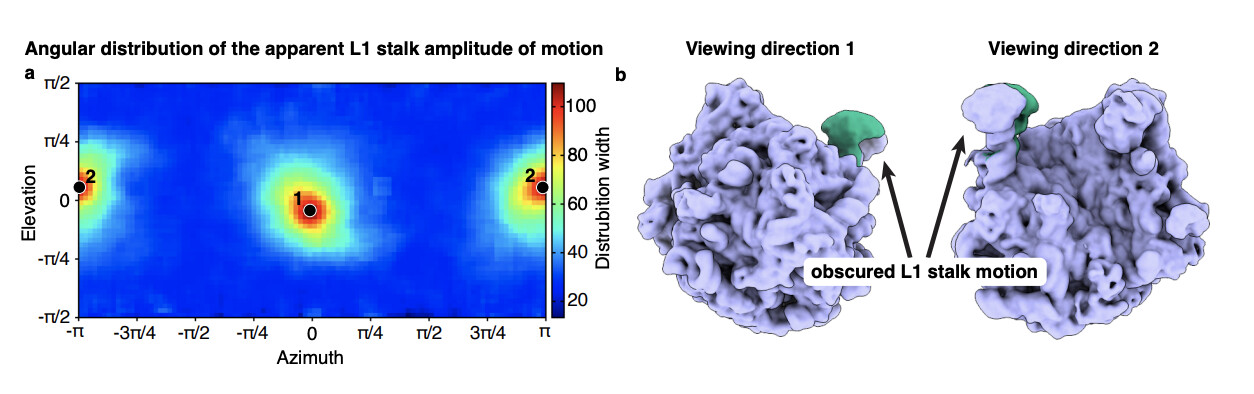
If you inspect the peaks of this plot, you find that these angles correlate with viewing directions where the majority of the motion (minus the noise of the component) is hidden.
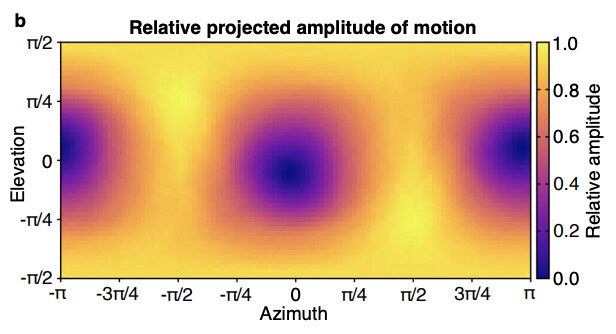
In fact, you can replicate this pattern computationally. Here, I took two structures at the negative and positive ends of the components and subtracted them from each other. I then orient the difference map according to the pose and sum the absolute values along the z-axis. Essentially this yields a projection of the component along a given direction. Then by summing the ‘pixel values’ of the resulting projection, I can measure the ‘apparent amplitude of motion’ for a component along a given direction.
My interpretation is that if a component has a variation along a direction upon which the main variation is hidden, the algorithm will assign it’s component value heavily based upon noise in the micrograph. Therefore, at these specific orientations you get component distributions that are very noisy and not necessarily representative of structural variation in the sample. By filtering out particles at the ‘hidden’ orientations we are then able to pull out the expected temperature trends in our sample.
Would it be possible to introduce a tool into CryoSPARC to analyze the 3dva component statistics versus particle orientation? It may also be useful to calculate a mask/degree of hidden variation in a component based upon particle pose or other factors. Additionally, if possible, it would be very helpful to be able to calculate a particle’s component value given a specific variability mode.
This finding is also explained more thoroughly in the SI of our paper here: https://doi.org/10.1101/2025.05.05.652279
Similar effects have also been mentioned by others as well: https://www.biorxiv.org/content/10.1101/2025.03.27.644168v1
Thank you!
Wyatt