One output of 3DVA is a series of maps ranging from 0 to 20. With this, we can make beautiful movies of a continuous movement.
My question is how continuous is really the data coming from 3DVA analysis?
If I understand well, 3DVA is capturing differences of subset of particles to the particular volume in input. Since there is a manifold of conformational changes, and 3DVA assumes a linear distribution, the outputs ranks it from beginning to the end. While it makes a lot of sense seeing it, I’m wondering if it is correct to see the continuity of the movement?
Is it really from frame001 to frame002, or is it that frame1 and 2 represent equally well populated distribution of proteins in the particle stack? And the thus the movement would be from input_volume to frame1, and then from input_volume to frame2?
The best way to think about it is to step back a bit and look at the image formation model (Eqn. 2 in the paper). The order is not random, nor are they equally populated. Including a successive 3DVA component with a correct coordinate value will improve the cross correlation score from projection matching (Eqn. 5). It’s also nice to compare conceptually how the coordinates and components are determined to the E and M steps during normal refinement. For this the preprint is more explicit (preprint Eqns. 6 and 7).
Given correct poses and correct latent coordinates from the E step, the components are reconstructed in the M step so as to best improve the projection matching scores according to the 3DVA image formation model (and subject to the orthogonality constraints). These components are essentially difference maps that modify the mean structure to better represent individual particles. When you make a series of frames using “simple” mode you are trying to represent the pure effect of each of these difference maps on the mean structure (without any effect from the other components). In contrast, you can use “intermediate” mode, in which case the particles are grouped along a given 3DVA axis and used for standard reconstruction using their known poses. Then the reconstructions are 1) standard reconstructions of grouped particles and 2) likely include some effects from all components at once (as they are all present in all the particle images), though the groups are only determined using one component at a time.
The conformational changes shown by the “simple” and “intermediate” modes should be quite similar, though “simple” mode will go “farther” in either direction. That they are similar shows empirically that the total ordering of the conformational states is broadly correct, since the “intermediates” mode is based on sliding window conformations along the coordinates.
To further supplement @DanielAsarnow’s excellent summary:
Is it really from frame001 to frame002, or is it that frame1 and 2 represent equally well populated distribution of proteins in the particle stack? And the thus the movement would be from input_volume to frame1, and then from input_volume to frame2?
Perhaps a useful way of thinking about this: each 3DVA component represents a ‘direction of change’ away from the consensus reconstruction. These ‘directions’ are computed by the EM procedure given your particle stack; each particle is assumed to come from a 3D density that is a linear combination of these directions and a consensus reconstruction. This doesn’t mean, however, that there exist particles that correspond to all possible structures along any of these directions, nor does it mean that an intermediate structure necessarily represents an ‘equally well populated’ intermediate state.
Namely, consider that:
The earlier components/directions are ‘more important’ in the sense that they represent more variation in the 3D density and hence most likely the dominant motion of your protein;
The simple mode visualizes small linear motion along one direction. If the dominant density change in your protein is non-linear (i.e., can’t be represented by adding scalar multiples of a density to the consensus), the resulting frames will be unrealistic in the sense that there is no weighted combination of particle images that would result in that density. Therefore:
To visualize larger non-linear motion present in your data, the Intermediates mode partitions particles into subsets defined by their ‘location’ along one direction of change, and then back-projects structures with each subset. Each of these intermediate structures is ‘real’ in the sense that it is directly computed from your particle images (as opposed to being constructed via the linearity assumption mentioned above). However, depending on the distribution of particles along this direction, each intermediate state may be computed with more or less particle images (you can see this explicitly if you turn on Intermediates: output particle subsets).
In case the above isn’t clear, you can also refer to our 3D Variability tutorial (part two) and the pre-print that Daniel mentioned for more info.
I’ve been reading the preprint many times over; your explanations are very useful to understand it better as the equations are a bit hard to follow.
So let’s say I have a nice movement in simple mode defined by 20 frames, it thus means that there is a main direction that is described by my particle distribution. This movement is assumed to be “linear”, which I guess means continuous in term of protein motions.
I originally thought that the 20 frames were computed by taking particles from the distribution and computed maps for each 20 subsets of particles. I actually asked to output these particles and they were a bit everywhere; what I gained from that was that my map wasn’t originating from discrete populations, I had “true” continuous heterogeneity. So do I understand well that each frame is computed by putting a different weight on each particle of the distribution, but using all the particles from my stack? (in simple mode).
So do I understand well that each frame is computed by putting a different weight on each particle of the distribution, but using all the particles from my stack? (in simple mode).
Nope, this is what happens in intermediates mode. Each frame in simple mode is computed by adding k*(3DVA density component) to the consensus reconstruction. The constant k takes on 20 values that range from the 3rd to 97th percentile (by default) of the coordinate values for that component that were computed across all of your particle images.
Thank you for this very helpful explanation! Regarding point 3 (intermediates mode), are the frames reconstructed completely independently? Or is this a weighted backprojection scheme of some kind?
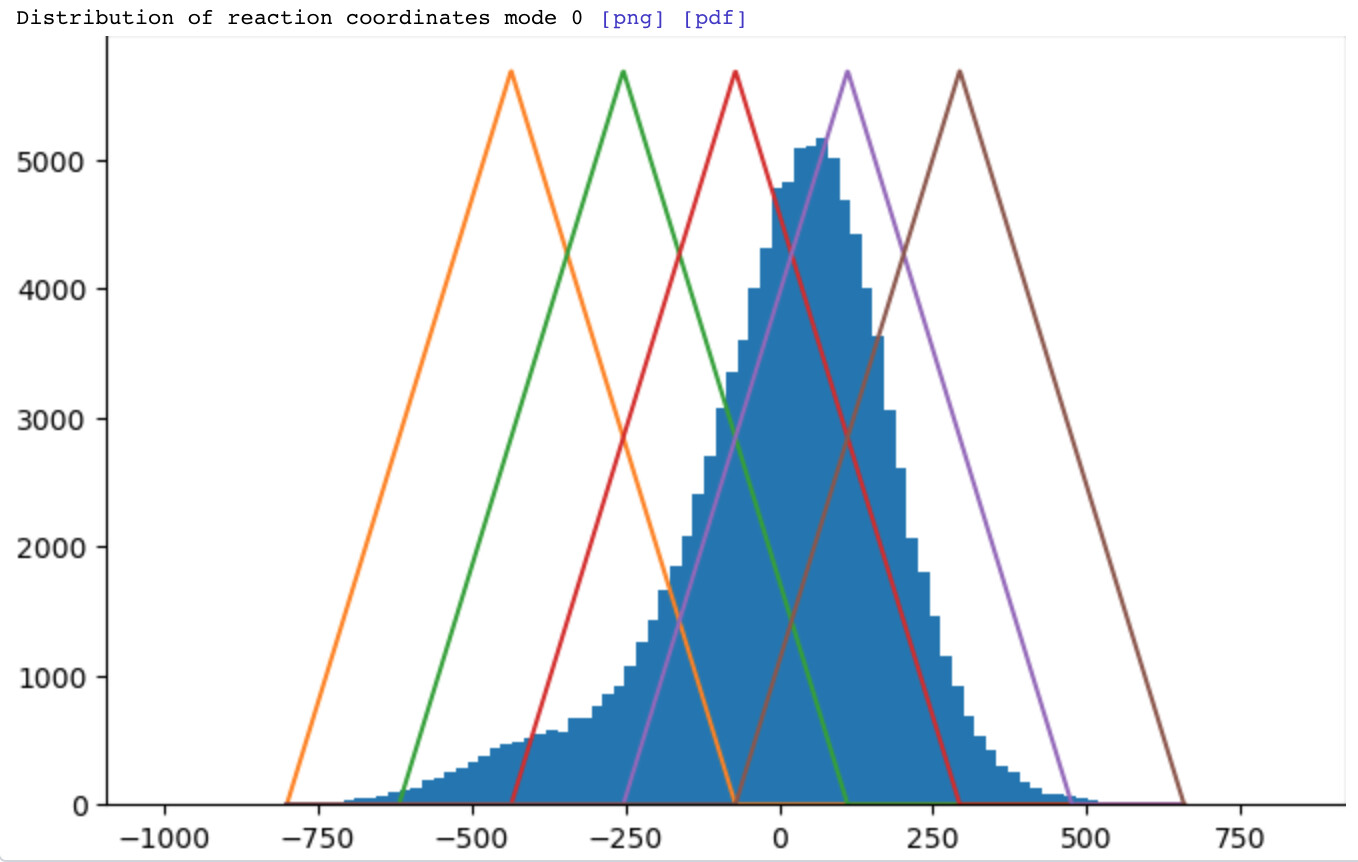
This will depend on the Intermediates: window (frames) parameter. By default, we use weighted backprojection with weights set by overlapping triangular weighting functions defined on the 3DVA coordinate:
Here, the Intermediates: window (frames) parameter is set to 2. Each of the 5 reconstructions will contain particles from up to 4 other reconstructions (though downweighted accordingly).
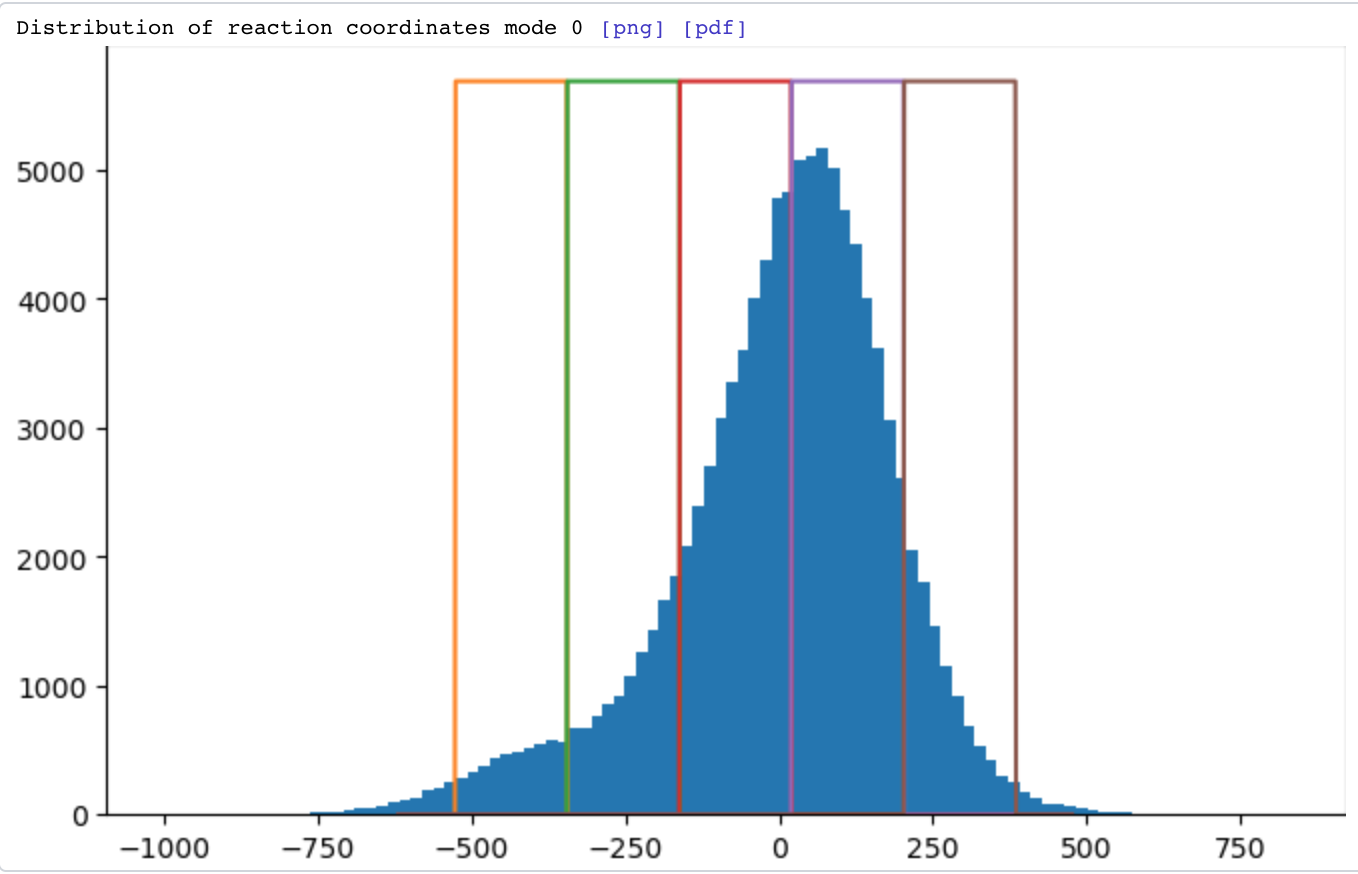
However, if you set Intermediates: window (frames) parameter to 0, the job will perform independent reconstructions with ‘top hat’ (i.e., either 1 or 0) non-overlapping weighting functions:
Thank you for these explanations.
I have a follow-up question related to the above:
Say I’m comparing 3DVA from 2 conditions.
Conditions A shows a movement, condition B shows a different movement. Is there a way to distinguish whether these 2 movements originate from the condition observed (i.e. protein response to a stimulus), or if they originate from a different set of particles (i.e. I’ve selected more particles in condition A than condition B and thus I’m able to observe a movement in A but not in B)?
The longer answer is that realistically you will see both motions in both conditions - since they are different motions they must be represented by different 3DVA components. If the conformations are similar, you can refine the particles together from both datasets and do 3DVA on the combination. Then after the fact, separate them and plot new histograms. You can see something like this in Extended Data Fig. 5 from this paper: Dispatched uses Na+ flux to power release of lipid-modified Hedgehog | Nature.