I’ve seen quite a lot of 3DVA movements and some protein movement appear larger with smaller latent coordinate values than others with larger latent coordinate values.
I’ve found on the description of the 3DFlex webpage (Tutorial: 3D Flexible Refinement | CryoSPARC Guide) that: “It is unclear how one should relate the continuous probability distribution of particle images in the 3DFlex latent space to a physically meaningful notion of energy via a Boltzmann distribution. This is because the non-linear capacity of the flow generator means that relative distances and volumes (and hence probability density) in the latent space are arbitrary.”
3DVA is linear, but I couldn’t find similar information on line or in the article, and imagine it is rather similar (?).
Should I understand that the values of latent coordinates (eigenvalues?) are not important per se but it’s more their distribution that matters when comparing 2 conditions? Would it make sense to report the latent coordinates in percentage instead of the actual value.
It also says that it is “an interesting area for future work”. Would you have more to share on this?
Hi @vincent! These are some good questions about 3DVA coordinates – let me see if I can address them.
3D Flex vs. 3DVA
I want to first emphasize that the coordinates in 3D Flex and 3DVA are fundamentally different – it is very difficult to make any direct comparisons between the two. We discuss the 3DVA and 3D Flex latent spaces in the workshop recordings linked above.
3DVA Movements
3DVA models movement by adding and subtracting density. It does not currently incorporate any information about where that density is being added and removed. Thus, even though the components are normalized so that a position of 1.0 along each coordinate corresponds to the same amount of density being added or removed, it might model more or less motion depending on the distance between where it’s being added or removed.
Because of this effect, it’s better to think of the variance of the particle’s coordinates rather than their exact values. A component which has a higher variance means that particles sample a greater range of conformations along that component.
thanks for the links, they are very useful as well as all your other posts. Thanks for making this effort to pass along the knowledge, it is very useful.
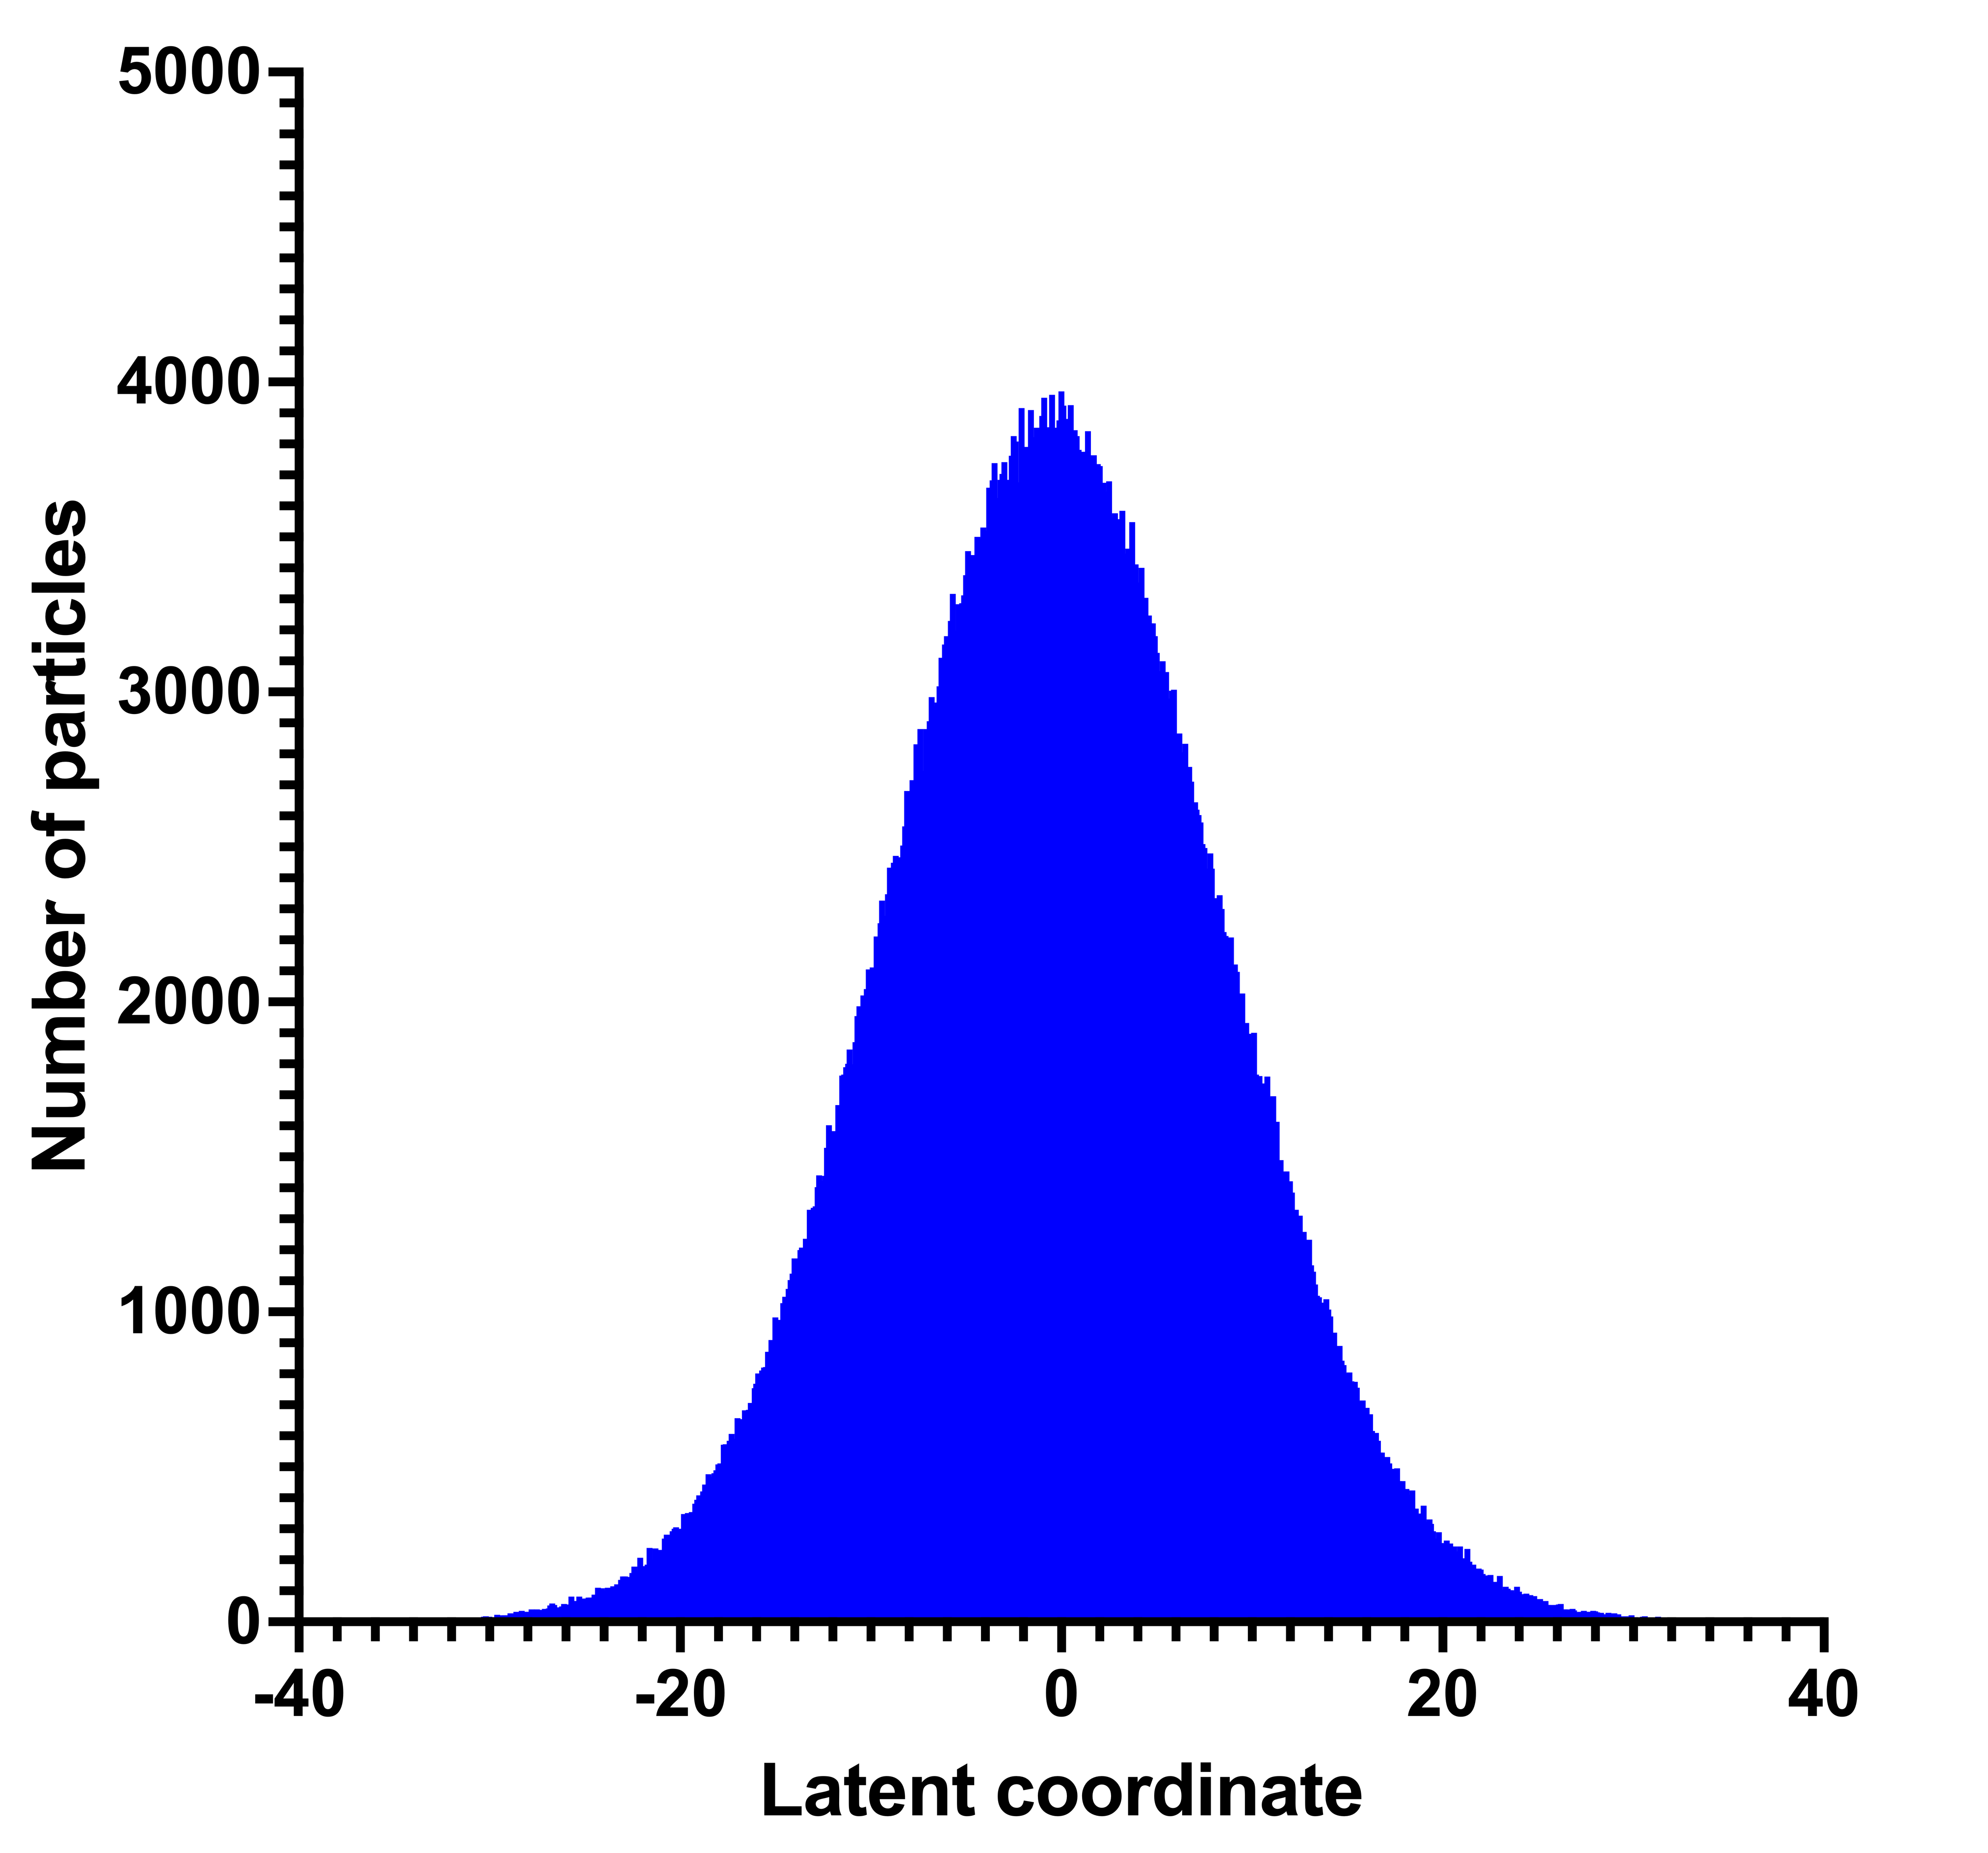
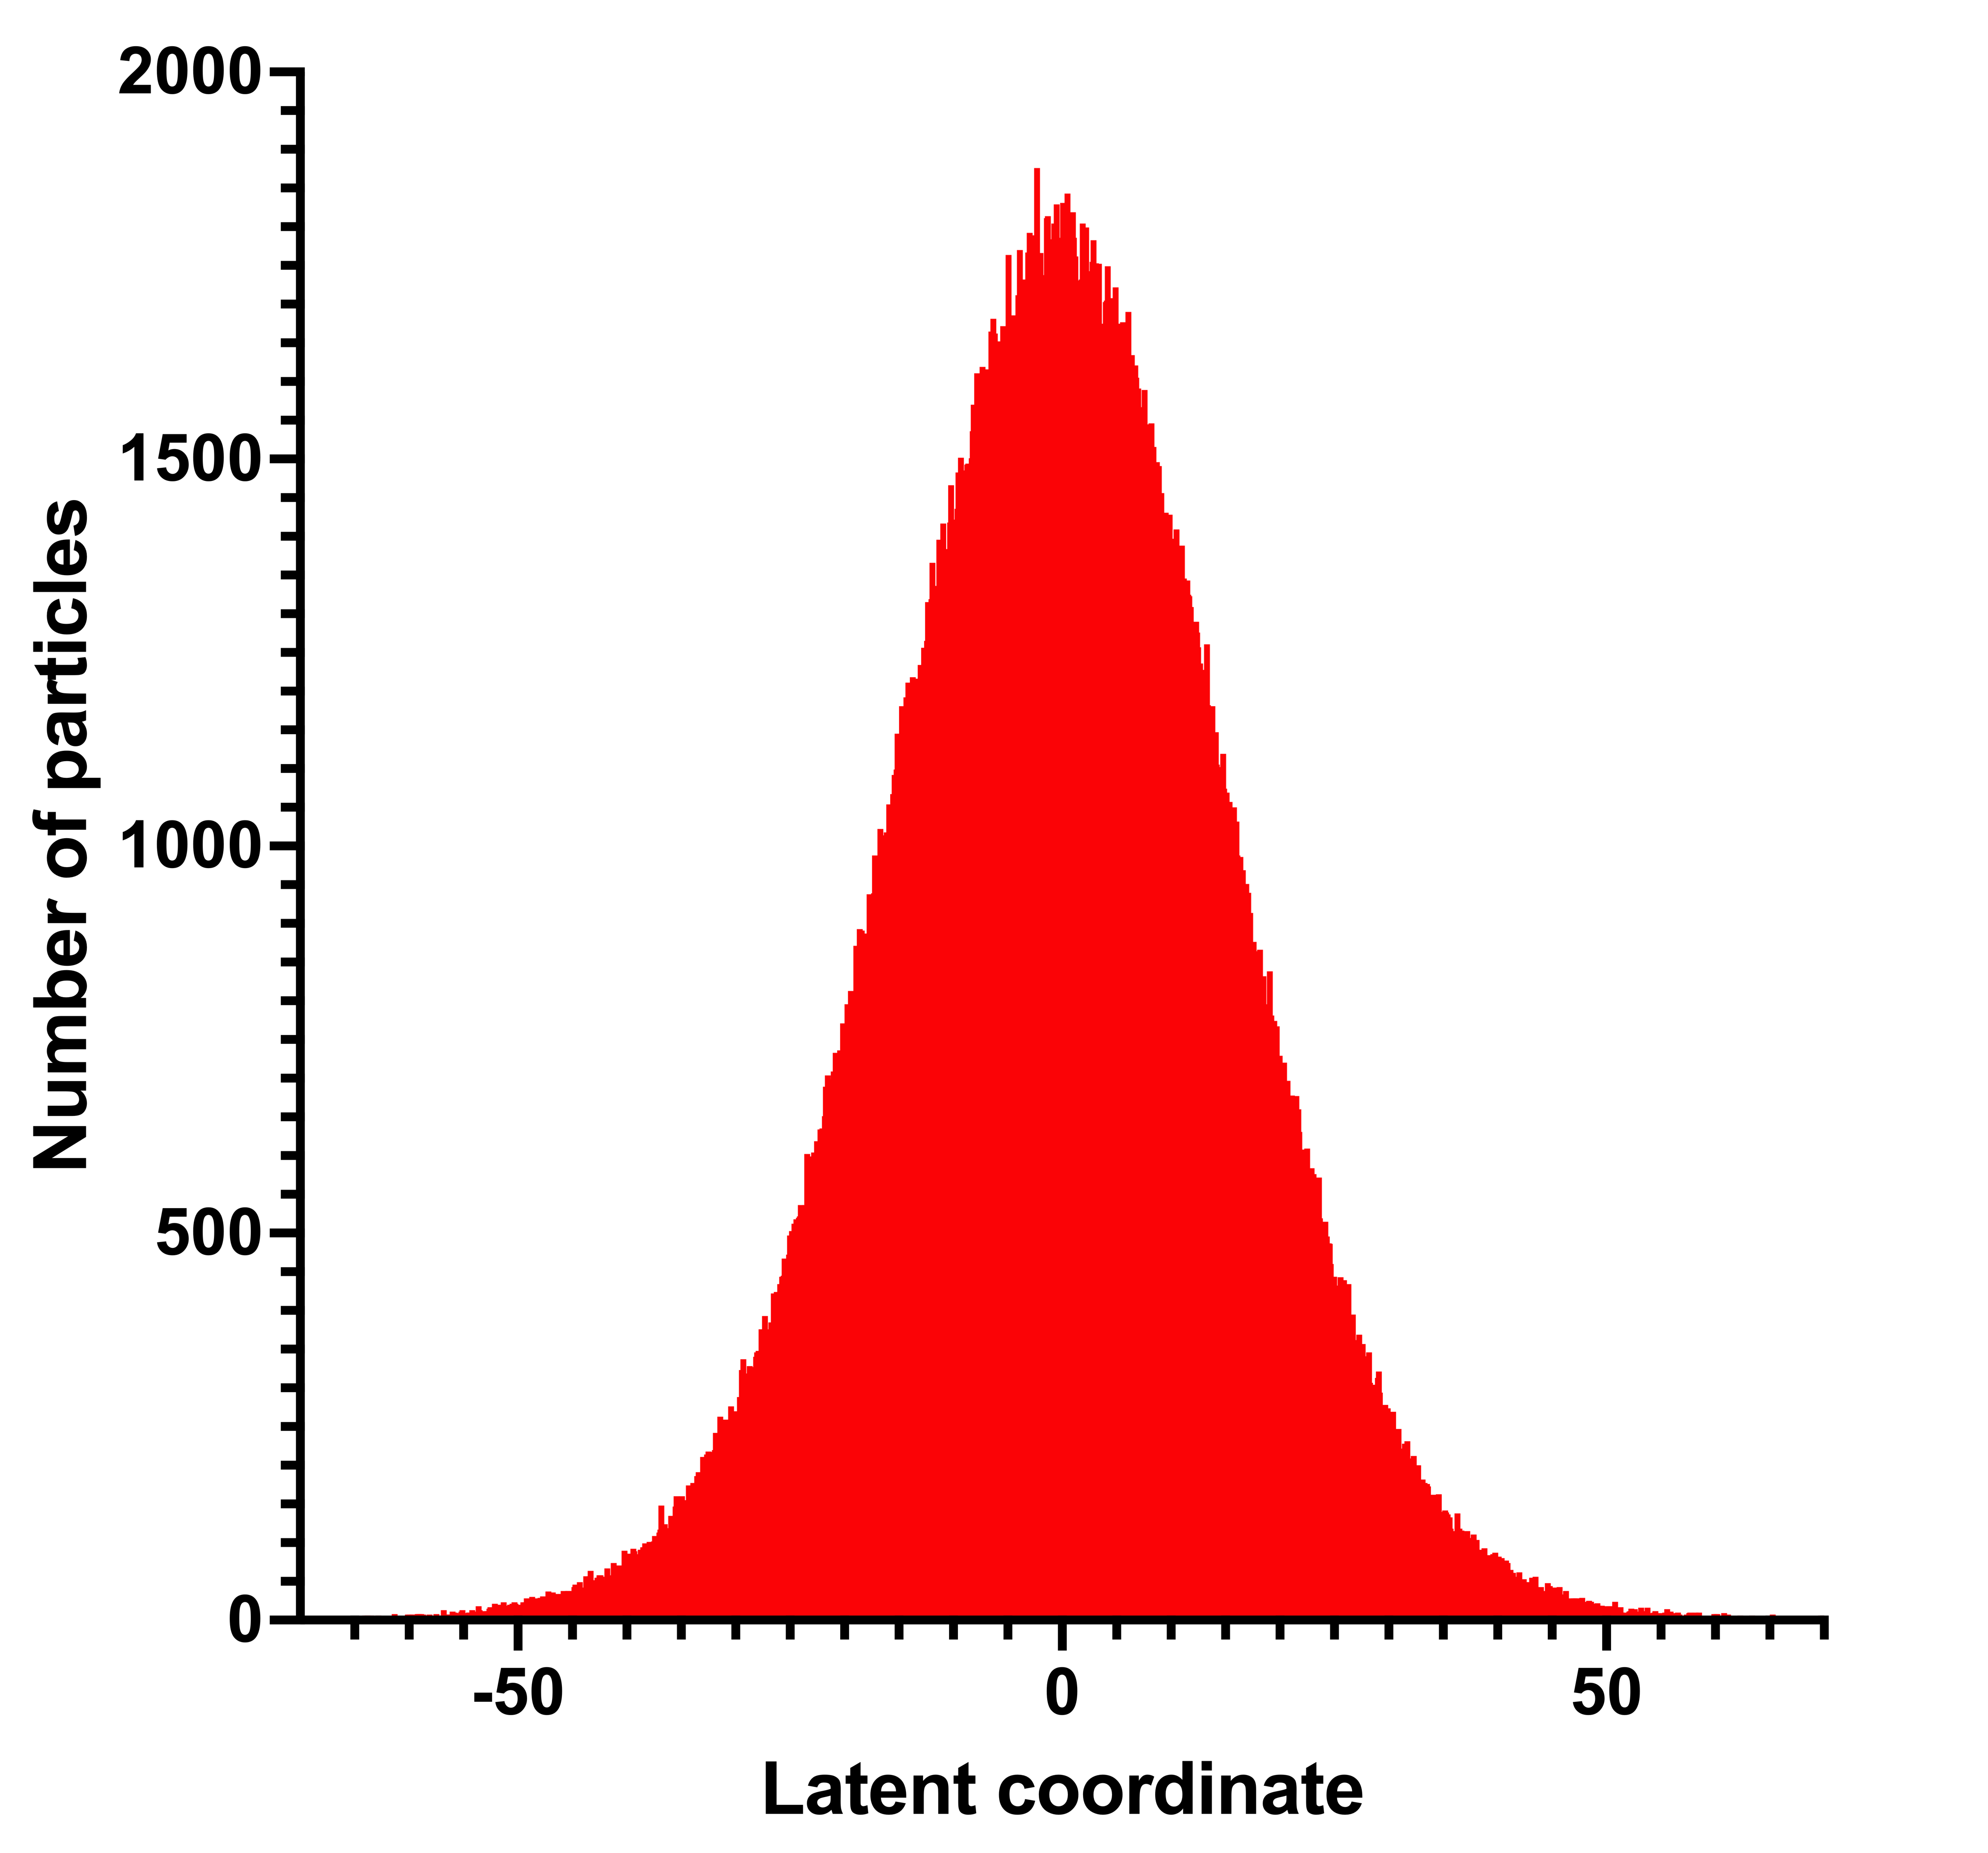
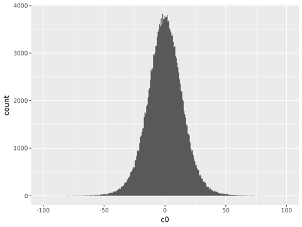
More precisely my question is that I have 3 membrane proteins of similar sizes. Let’s say we only focus on the first component, the first protein in blue will have a spread of +/- 20 latent coordinate, while the second (red) will have a spread of +/- 50. But, the movement observed on the 2 proteins will be the same and have the same amplitude. For the 3rd protein in black, the spread is also +/- 50 but the movement is very limited, just a general vibration.
Thus, I’m wondering the relationship between the spread of particle variance along the latent coordinates and the relationship with the movement that we observe.
Also, to echo your video on 3DVA, we always compute in simple and intermediate modes, with 0 or -1 for the particle overlapping or equal size bins. For our cases, we always observe the same deformations and domain variations/movements in-between modes, so we end up using the simple mode as it describes more cleanly the same movement. For our last case (corresponding to the black distribution) we even have the same movies in the end between the different modes. And just to be clear, we are visualizing protein movements, not detergent-belt related variations.
Ah, do these coordinates all come from different 3DVA runs? The exact coordinate values are currently only normalized within a single 3DVA job, so to make comparisons between datasets you’ll have to do it more-or-less by eye (as it sounds like you already are).
Yes they comes from 3 different projects.
But then, within one project and from the same set of particles from the same job, if I restart 2 3DVA jobs asking for more components for example, will they have different values?
It would be useful to be able to compare across jobs and across projects if possible.
In theory, 3DVA should find modes in decreasing order of explained variance, so the first mode should remain more-or-less the same across runs of the same data. That being said, it is always worth inspecting the modes yourself!
I’ve noted your request to make 3DVA more comparable across samples.