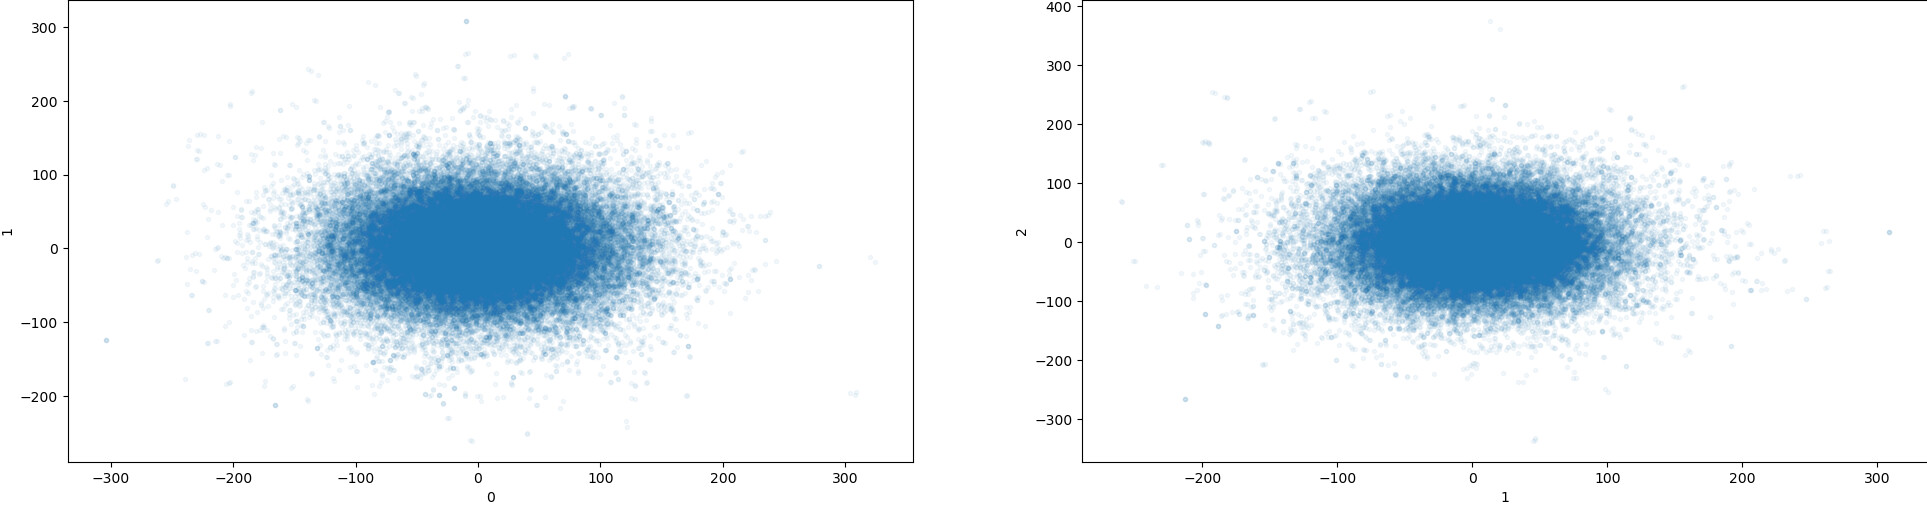
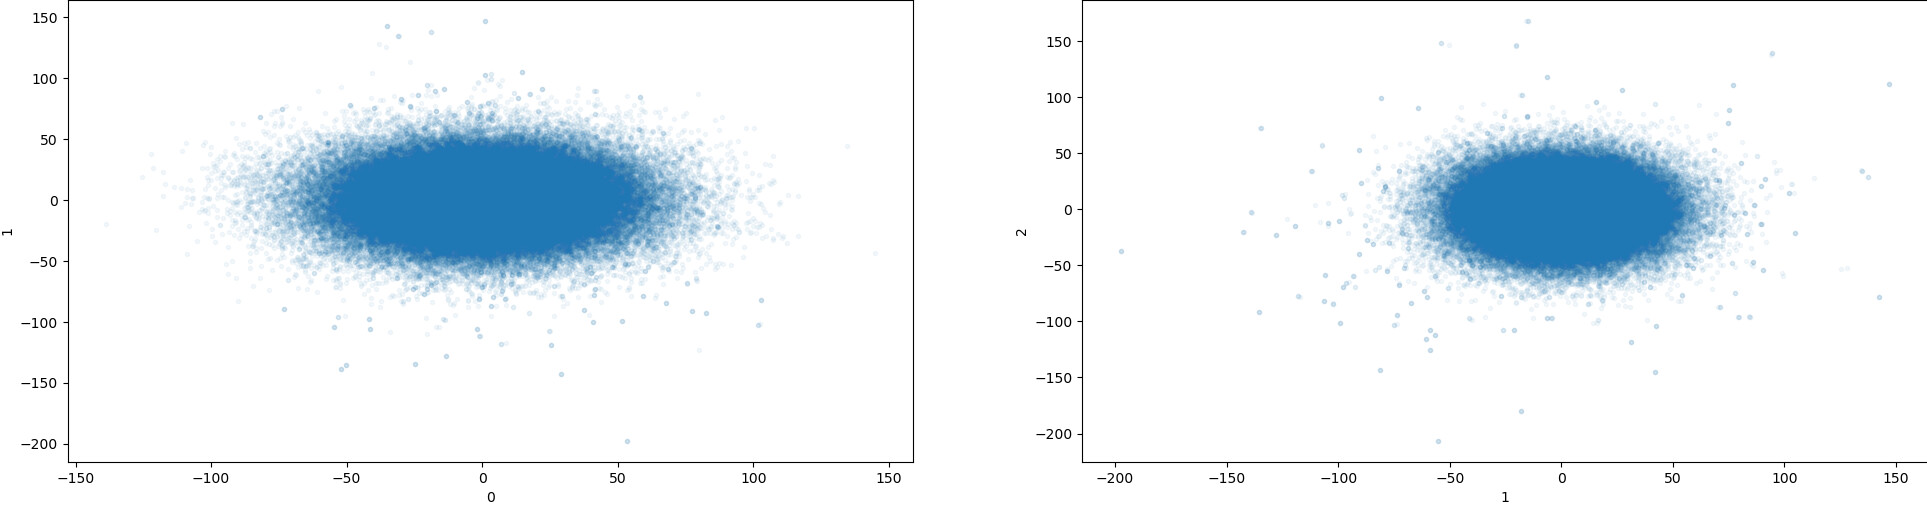
I have two conformations from one cryoEM data and performed 3DVA to see if there are different dynamic motions. Interestingly, 3 components I’ve got showed different motions from two distinct conformations. But I was not sure if I can tell which one is the most dominant motion from the 3DV result. (attached a plot).
I found a statement from cryoSPARC guide saying ‘Clearly, the first component (0) has the most variability.’ I wonder if anyone could tell how to interpret the data.
Hi Min,
It is not straight forward to answer the question, because the low SNR of the data causes the component magnitudes to be very similar, even though the first one is always the “largest.” Also, any single particle is described by a combination of all the components, so what one component looks like can’t necessarily give you a “dominant” motion.
Ultimately, you will have to inspect the components and fit them into your understanding of the protein, realizing that all the components are present in the real particles.
When you say you have different motions from two distinct conformers, do you mean that there are two 3DVA components that have very similar conformations at the extremes, but show a different trajectory of changes? That is pretty interesting and could imply that both sets of changes really co-occur in the particles, or alternatively, that they complementary parts of a conformational cycle (e.g. a functional step followed by a reset).
I appreciate your reply and sharing previous discussions. It was very helpful.
I think I understand that we cannot tell the exact percentage of the variance of one component because 3DVA considers the mean signal is in Gaussian distribution and use PPCA than PCA. So, the “sum” of all of the probability of components would be basically an input map as you described.
Regarding the motions that I observed in conformer1 and conformer2, (BTY, I used K=3 for 3DVA) both conformers show ’ swinging motion’ of domain1 and such motions were component 0 in conformer1 while conformer2 showed 'up-down’ motion of domain2.
To cross-check the motions, I also tried Relion’s Multibody-refinement for domain1 and domain2 although I’m dumping out the probability of other motions by defining ‘body’. And it showed consistent motions: ‘swinging’ motions of domain1 and ‘up-down’ motion of domain2. The only question I have is if it is fair to say one component from 3DVA could be considered as the most variable motion if the scatter plot shows wider distributions in one component than another component.
Below is what I found from the published 3DVA paper, and wonder if my argument would make sense, and agreeable if I have such descriptions in the paper.
’ … since components with large variance explain the most variability in the data’
‘…Running 3DVA with K = 3 will yield the top three variability components that explain the most variability in the data, and running with K = 6 will yield the same three plus the next three important components’.
A couple salient points here (largely reiterating the excellent response given by @DanielAsarnow):
The 3DVA components will be ordered by the magnitude of the variance of their corresponding latent/reaction coordinate across all particles in your data (in descending order). Thus, the first component will account for the largest variance in latent space, making it the ‘most important’ component in explaining the observed variation. Likewise, variability component 1 will have more importance than 2, etc. Further, these components are a ‘global solution’ in the sense that the algorithm will always yield the same top K components (modulo numerical precision). This is what the two points you mentioned above are referring to.
Although each component ‘explains’ the variation in the data, the variation itself may come from noise or other effects, and therefore moving in the ‘direction’ of a particular component may not represent a physically-realizable ‘motion’.
Finally, although the latent coordinates are statistically uncorrelated, they are not (necessarily) independent. Therefore, motion may induce changes in multiple coordinates at once.
Thus, it is not fair to say that the most ‘most dominant/variable motion’ (i.e., one that the structure actually undergoes) is defined by the first variation component. As @DanielAsarnow mentioned, this will require further domain knowledge to tease out.
Note that you can find some more information about the properties of 3DVA in our webinar (I’ve timestamped this link to the section on 3DVA properties where Ali expands on the points mentioned above):
Thanks so much for the elaborated explanation as the response given by @DanielAsarnow. Your reply and also the video tutorial was also helpful to understand the paper conceptually better.
With that, I understand your statement below and agree with it. > Thus, it is not fair to say that the most ‘most dominant/variable motion’ (i.e., one that the structure actually undergoes) is defined by the first variation component.
But I was trying to interpret the scatter plot (attached here again) to tell the variability, not necessarily by order of component 0 and component 1 and so on.
If I understand correctly, running 3DVA with K=3 will yield the top three variability components that explain the most variability in the data, and one could think that the component showing more (or the most) large variance explains the most variability in the data.
I wonder if one could help me to interpret the scatter plot (attache above) and please correct me if my interpretation; component 0 in the attached scatter plot has the most variability, is wrong.
You are right, but all the components explain a tiny fraction of the total variance, because of the low SNR. It is the “most” variability in that it is larger than the other components, but it is not “most of the variability.” Which components are the most interesting still has to be determined by inspection.