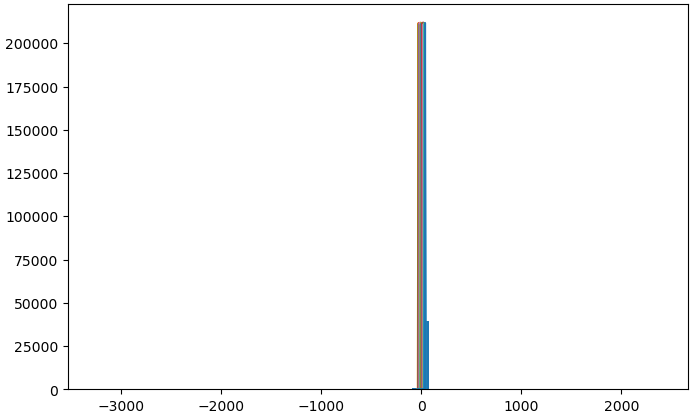
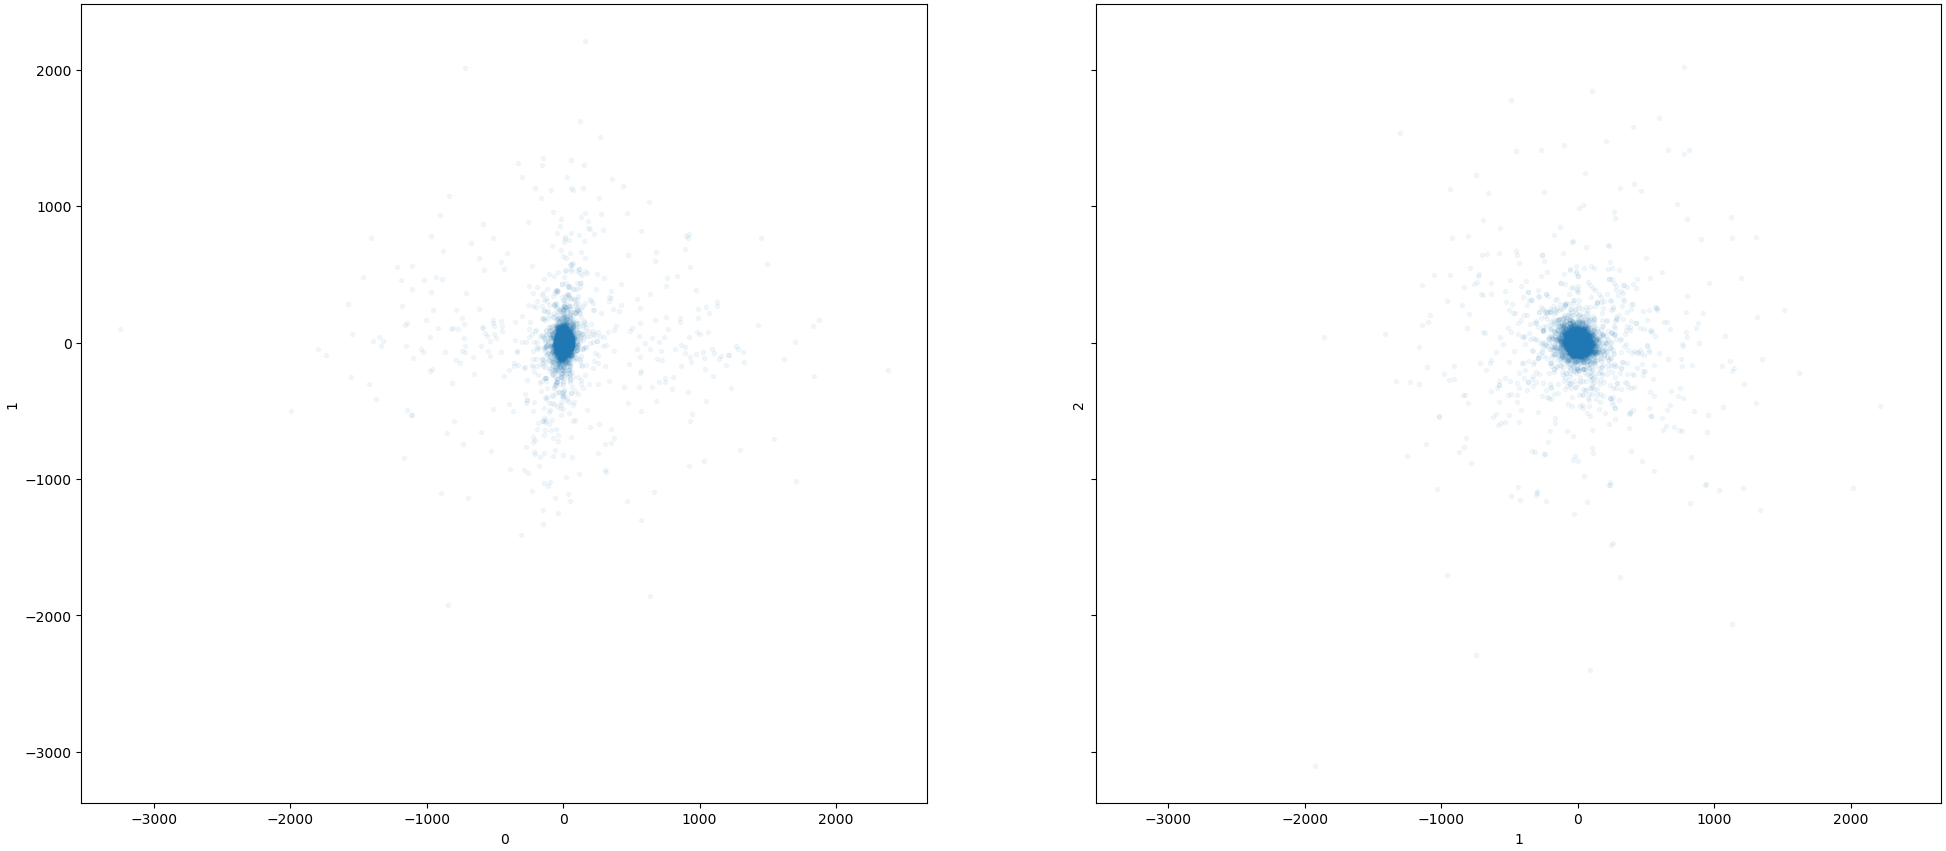
The distribution of reaction coordinate plots for my recent 3DVA jobs have been very high, which makes the interpretation of the produced plots hard.
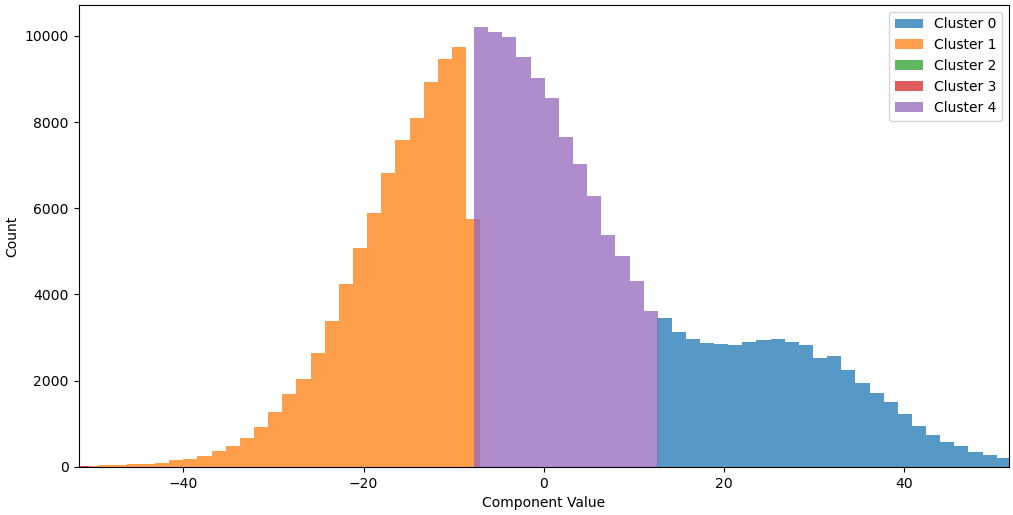
When running 3DVA Display with Clusters, the plots are rescaled to exclude the extremes of the plot, but the Intermediate and Simple displays are not scaled, making it difficult to observe where the rolling window frames are located.
I thought perhaps changing the parameter “var_range_percentile” would help, but it doesn’t seem to have an effect on the Intermediate display type.
I am using quite a generous solvent mask for the 3DVA run, with a filter resolution of 6 Å. Not sure if that is contributing to the large spread of reaction coordinates? Any tips on how to reduce?
CryoSPARC Version: Master running v5.0.4, worker running v5.0.4
3DVA Reaction Coordinates
3DVA Display Component 0, Clusters(5):
3DVA Display Component 0, Intermediate(20):