Hi @team ,
is it possible to visualize the trajectory of each component through the particle cloud in a 3DVA job?
Thank you.
Vincent
Hi @team ,
is it possible to visualize the trajectory of each component through the particle cloud in a 3DVA job?
Thank you.
Vincent
Hi @vincent!
Are you wanting to view the trajectories of each volume series in the 3DVA coordinate space? The volume series are just generated along each axis. That is, volume series 0 travels along the component 0 axis, series 1 along component 1, etc.
Hi @rwaldo ,
yes I would like to visualize the trajectory of each component through the particle cloud in X,Y,Z (indeed, 3DVA coordinate space).
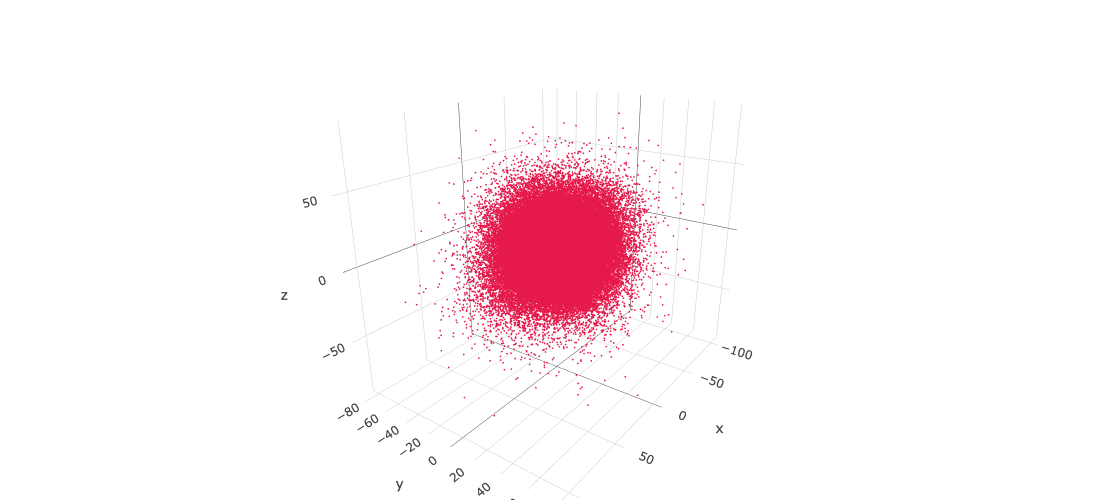
For example in such a cloud:
Thanks
Vincent
Hi @vincent! Sorry, I think I am still not understanding. Are you wanting to draw a line through the point cloud along each axis?
Well, this cloud is fairly globular but for a more “shaped” cloud, then visualizing more easily how the volume series travels along each component can help make sense of the movement we are seeing afterwards. It can also help compare 2 cryoEM datasets for which we see different movements, with and without ligands for example.
Since volume series are reconstructions through this cloud, I’d like to visualize the trajectory to help me better understand the whole process.
If you’re referring to the volume series generated by the 3DVA Display job, it is simply a series of volumes along each axis as I mentioned. So, series 0 travels along (X, 0, 0), series 1 travels along (0, Y, 0), series 2 travels along (0, 0, Z).
Does this make sense?
Seems like you want something like the graph traversal procedure in cryoDRGN. Instead of following principal components to generate the map series, it goes from point to point in a nearest-neighbor fashion, and visiting the anchor points you provide.
Thanks to both of you for your reponse.
Initially, I was indeed thinking like @Guillaume , but @rwaldo responses brought more light to my understanding of this whole procedure, which is not easy to grasp even though when we see the volumes it looks so intuitive.
In the end, I want to compare protein movement accross multiple datasets, with and without ligand, different environments, etc… So I need a deeper understanding of what this movements are and how they have been calculated. Thus, to be able to visualize/compare the (X,0,0) trajectory would be useful. When I look at he cloud above, it is not exactly easy to see it. Not many particles are exactly on this line. Does it mean that in the intermediate mode when maps are calculated from particles, we are removing many particles from map calculations?
Yes, unfortunately the interpretation of these methods of continuous heterogeneity analysis are a bit hard to interpret! You are certainly not alone in being confused by them!
Unfortunately, directly comparing differences in the results of a 3DVA job across datasets is not really possible. There’s no guarantee that the same type of motion will be assigned to the same component. Put another way, in dataset A a certain type of movement might be component 0, but in dataset B that type of movement might be component 1 instead. You’ll have to manually inspect the components to see if there are any that correlate with each other.
As to how the trajectories are calculated, that has a more definitive answer. There are three different modes of 3DVA Display: Simple, Intermediate, and Cluster. There’s a lot of information on these modes in the guide pages for the 3DVA tutorial, but I’ll summarize for you here. If you’re not familiar with the inner workings of 3DVA, you may want to check out the paper describing the technique. I’ve also written a bit about the difference between 3DVA and 3D Flex in another forum post.
The Simple mode takes the difference volume for the component and scales it by the coordinate, then adds that to the consensus volume. So (-1, 0, 0) corresponds to subtracting the component zero difference volume from the consensus, while (50, 0, 0) corresponds to scaling the component zero difference volume by 50, then adding that to the consensus.
You’ve already noticed the tricky bit of this method: you’re not actually taking into account how many particles might be near the coordinate you make a reconstruction for! For instance, there might be very few particles anywhere near (-100, 0, 0). The simple mode calculates the volume anyway. This usually results in the most extreme frames of a simple display job being quite noisy.
In the intermediate mode, we choose several points along each component, like for Simple mode. However, this time, we perform reconstructions of actual particles, weighted by how close they are to those positions. You thus still get maps that are sampled along a single coordinate, but they take into account real particle images that have a value similar to that coordinate.
Note that they are not necessarily nearby — for instance, a particle at (0.5, 0, 0) and a particle at (0.5, 100, 100) would be used to create the “coordinate 0 == 0.5” map in Intermediate mode.
In clustering mode, the particles are clustered, taking into account all of the coordinates at once. These clusters are then used to reconstruct maps. If there are distinct clusters, this can create very distinct classes. In a situation like yours, with a relatively spherical distribution of coordinates, it can still be helpful since it takes into account all of the coordinates at once, but you lose the nice sense of sequence (i.e., cluster 1 might be right next to cluster 9).
I hope that’s helpful @vincent! I’m happy to answer any more questions you might have, sorry it took me a little bit to understand what you were looking for!
Thank you @rwaldo for taking the time for this detailed explanation, which is very enlightening.
I definitely understand it better now and I saved it for my records.
I used to calculate 3DVA in simple mode at the beginning, as it gave me the same results as the intermediate mode, and well… simple is good enough for me. I’ve been realizing not too long ago that intermediate mode might be better as it calculates a “real” map from particles, and have been calculating in intermediate mode ever since. Perhaps, intermediate should be the default? I would also suggest a change of wording for simple and intermediate as it is confusing in the end. What about “difference volume mode” and “reconstruction mode”?
3DVA is very interesting to me as it uses a principal component analysis to show the movement. This simplifies the movement and allows for easier downstream analysis. I’ve created phenix.varref to refine an ensemble of PDBs inside the maps from 3DVA in order to analyze the movement in depth. It took me some time to understand that, as you write it, we can’t compare component 0 from one job to component 0 of another job; it makes good sense as it depends on how we choose the particles for the job and particle distributions are not equivalent across datasets and thus the position of the component will vary. But what we can do is compare types of movements undergone by the protein, and how ligands influence these movements. For example, I can see a rotation centered on a beta sheet; the presence of a ligand allosterically influences this rotation to reduce it by half compared to the apo form. Then I can move on to comparing another type of movement, etc… until I sample the whole conformational space of the protein and visualize how the ligand influences the conformational spectrum.
This analysis works well for this particular dataset as the particle clouds are fairly round in component space. For another project, and this was the reason of my query which I should have detailed more I guess, I have a particle cloud with a shape, out of which I can refine 2 separate conformations using cluster mode or heterogenous refinement or 3D classification. But, what I can do using 3DVA is also to follow the whole transition between these 2 conformations, which is extremely interesting! In comp0, I can see one movement probably across the long part of the cloud. But in comp1 or 2, I see movements that I would like to trace back to one or the other form as my interpretation of them may vary. It could be that the PCA analysis goes through an “horizontal way” across only one part of the cloud, which would correspond to only one conformation. This was the original query. Thanks to your explanations above, I will have a closer look and see if I can make sense of it.
Thanks again
Vincent
If I understand correctly how 3DVA works, it guarantees that the first principal component will always show you the motion with the largest magnitude, and subsequent components will show other modes of motion sorted by decreasing magnitude (a general property of PCA).
This can be useful to compare different datasets, because if the motion identified as the first principal component is a different mode between, say, with or without ligand, then you learn something interesting already simply by comparing the first component.
But it doesn’t tell you how different they are, just the order - if they are all comparable in magnitude then comparing the order of the first few modes won’t tell you much I think?
This is correct, provided of course that you trust that your particle curation process was also comparable between the two datasets.