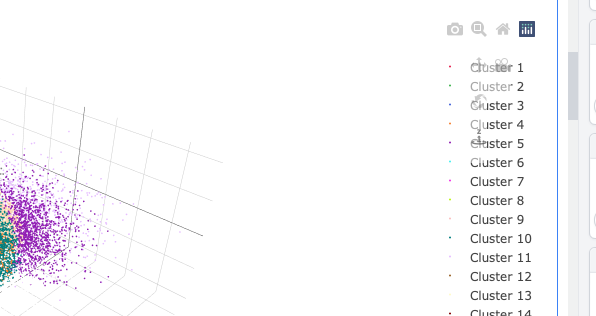
In the interactive scatter plot, the navigation control overlay obscures the cluster legend when hovering in the area. The clusters can still be selected by clicking just off to the left for the time being. v4.0.1 in Safari (16.0) and Firefox (105.0.3) on macOS (12.6).
Update: I’ve also noticed that the layout does not re-scale following toggling of either the outputs group subpanel or sidebar. For instance, the cluster legend is obscured if the sidebar is expanded when it wasn’t initially. Somewhat similar to the behaviour in the Volumes panel reported here.
Any updates on the fix, @sdawood? The inability to click clusters 1 to 5 drives me up the wall.
Another issue I want to raise is that the cluster index in the plot starts with 1, but the output cluster index begins with 0. It would be nice to be consistent here to avoid any unnecessary mistakes.
As of now, in v4.5.3, the cluster in the “Interactive Clustered Scatter Plots” still starts from 1 and the “Output Groups” particles cluster begins with 0. I would say this issue is not fixed yet. The issue for selecting the first few clusters has been fixed.
Thanks @jhzhu , the functionality issue of the labels not being clickable and the plot not resizing when the window is resized have both been fixed. We’ll work to resolve this visual inconsistency for an upcoming release.