I have a new computation problem with no clear path forward - interested in expert help and can connect with our computational experts. @vperetroukhin@wtempel
v4.0.3. 3D classification jobs are all failing, typically late stage, with memory error. We are using Amazon A10G G5 with 22Gb useable memory per GPU id. Several of these jobs were relatively large - 3million particles 320 box 80 classes or so. Since then I have re-run extraction 4-fold fourier cropped so 80 pixel box. Even some smaller jobs ~1.5million 40 classes are failing even after binning. All jobs use resolution max ~8-10Å. In one instance a job failed after 10 hours, not even using the whole dataset yet, only 80k binned particles. Occasionally a smaller job will finish normally.
Have others observed instability in the job type, changes in the required memory in V4 implementation of this job vs V3? Are there other ways to troubleshoot why this is happening? At least “save outputs F-EM” is getting me some progress, but it would be great to have jobs finish normally. I also had a job complete, but exit abnormally such that I had to “mark as complete” to use the files as parents.
Relatively large jobs seemed to work normally ~1month ago, and outside the initial failure of trying to create 100 PCA references, the job type worked stably for the past year.
Finished iteration 47 in 990.360s. Total time so far 37466.030s

-------------- Iteration 48 --------------

    [Online EM] Spooled a batch of 80000 particles

    Parameter settings:

        O-EM lr: 0.206 (schedule: 0.400-0.147)

        Class similarity: 0.000 (schedule: 0.200-0.000)

    Computing expectation step (batch A), processed 40000 / 40000 particles
        THR 0 TOTAL 9824.7267 ELAPSED 270.87119 --

    Computing expectation step (batch B), processed 40000 / 40000 particles
        THR 0 TOTAL 9863.6941 ELAPSED 270.33594 --

    Computing maximization step, processed class 80 / 80

    Updating noise model (per Fourier shell, averaged over 80 classes)

Traceback (most recent call last):
  File "cryosparc_worker/cryosparc_compute/run.py", line 93, in cryosparc_compute.run.main
  File "cryosparc_worker/cryosparc_compute/jobs/class3D/run.py", line 699, in cryosparc_compute.jobs.class3D.run.run_class_3D
  File "cryosparc_worker/cryosparc_compute/engine/newengine.py", line 2873, in cryosparc_compute.engine.newengine.get_initial_noise_estimate
  File "cryosparc_worker/cryosparc_compute/engine/newengine.py", line 2898, in cryosparc_compute.engine.newengine.get_initial_noise_estimate
  File "cryosparc_worker/cryosparc_compute/engine/newengine.py", line 650, in cryosparc_compute.engine.newengine.EngineThread.compute_ctf
  File "cryosparc_worker/cryosparc_compute/engine/cuda_core.py", line 337, in cryosparc_compute.engine.cuda_core.EngineBaseThread.ensure_allocated
pycuda._driver.MemoryError: cuMemHostAlloc failed: out of memory
This error points to a lack of host memory rather than GPU memory. Which “size” of the G5 instance type and what kernel version (uname -a) are you running?
What “CPU:” memory usage did you observe in the stream log?
you mean the blue ever-increasing CPU usage? in one case the job failed at 38Gb, another 40Gb, another 63Gb (printed 38Gb at the end), another 14Gb.
Thu Jun 10 13:32:12 UTC 2021 x86_64 x86_64 x86_64 GNU/Linux (this is within one of the node, that right info?)
We use G5.12x large. Could conceivably move to 24x for more host memory. Also following up on whether a single GPU is dedicated per job, or if they’re accidentally being forced to handle multiple jobs simultaneously while other GPU are availble.
Please can you post the output of cryosparcm cli "get_scheduler_targets()".
If you can identify two specific jobs that were competing for the same GPU, please can you email us the job reports for those two jobs as well as the output of cryosparcm snaplogs.
As I understand it, our issue is resolved through multiple routes: 1) upgrade to 24x large and put to designated lane. 2) we now have our instance set to exclusive process instead of default compute mode. With these changes I get the desired effect: queue 4 jobs, all run and verified are independent GPU via nvidia-smi, queue a 5th it waits for GPU, queue a 6th by designating a GPU (id=0, already in use) and the job starts up but immediately fails.
It will be a couple days before I can be confident that memory issues are resolved, and it won’t necessarily be clear whether it was fix #1 or fix #2 mentioned above.
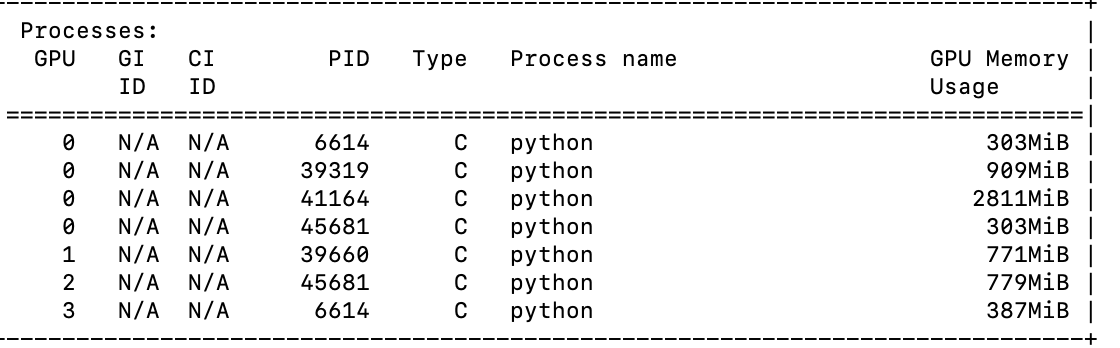
i tried cryosparcm command but can’t get it to work, I’m sure our admin could. the snaplogs are unfortunately gone as these jobs have been killed, cleared, and requeued. attached is a screenshot of nvidia-smi where I noticed multiple GPUid 0 running.
I will update when I know if situation has resolved. If you would like me to push for better understanding about our “fix” and/or our scheduler targets I can reach out, but my guess is the data content has changed since we modulated our setup today.
If your problem has been resolved or, at minimum, you are testing promising candidates for a resolution, there is no need to chase additional logs at this time.
@CryoEM2 FYI v4.1.2 includes a fix for a memory leak (related to plotting) that was most likely causing the behaviour you describe here:
you mean the blue ever-increasing CPU usage? in one case the job failed at 38Gb, another 40Gb, another 63Gb (printed 38Gb at the end), another 14Gb.
3D classification should now require significantly less host (i.e., non-GPU) memory, especially so for jobs with large amounts of classes. In our testing, a 100-class job went from ~85GB peak to ~25GB peak. If you get the chance to update/test, let us know any feedback.