3D classification gives identical classes

Hi all,

I’m solving the structure of a filament-like protein. It is quite flexible so I’m trying to get the most homogeneous population of particles with 3D classification. However, when I classify ~690K particles in 6 classes, every class looks similar including the number of particles. As you can see I already set the class similarity parameter to 0.
Do you have any other recommendation on what parameter I can play with?

bump target resolution to 10 or higher. consider masking a smaller (single repeating unit) section? looks like not a strong refinement start. what does the real-space difference plots look like? red blue speckles or red sections and blue sections? consider PCA start (not simple) though in practice this hasn’t changed much for me. can always try force hard classification, should give different results including more diversity in particle counts (sometimes an ~empty class too).

Thanks, I’ll try to change those variables including forcing hard classification. The real-space plots looks like as follow!

fascinating! blue means “missing in this structure” and red means “more present in this structure than others”. This vertical striation pattern makes me think that either 1) the refinement that lead to this job is not high res, and did not resolve position outside the middle of the 3 repeats 2) there is a funky foreground/background focus thing, 3) these filaments are likely not straight and it’s separating the different curve positions.

I don’t study filaments and an expert would be more helpful. But I think there WAS some intelligent separation output of this job, you should check them with high threshold as volume series in chimera to see the motions of the different outputs, if you have lots of particles take a single class and redo (class 1 and class 3 are opposites, for instance). Most importantly, I think you need a more homogeneous dataset with great refinement to get the most out of 3D class job. Consider switching to 3DVA in cluster mode prior to this analysis, and redo with distinct clusters.

2 Likes

Yes, the refinement that lead to this job was medium res (5-6 A range). The series of volumes coming out of this 3D classification reveals high flexibility (heterogeneity) indeed (gif attached). However, if I select individual 3D classes coming out of this job, refine them and/or re-perform with them 3D classification again, the output volume series looks still highly flexible and the ultimate refined classes seems to be “diluted”, meaning that would look similar but the resolution and the quality of the reconstruction would look worse than the initial one (the one before the first ever 3D classification).

At this point, I’m playing with the mask and 3DVA.

Screen Recording 2023-09-24 at 3.09.30 PM

Hey @lorago92 – couldn’t help but jump in here – super fascinating! Based on what you’re describing, perhaps this filament is undergoing a continuous deformation / flexing motion. Depending on how intricate this deformation is, it might make sense that 3D class isn’t able to adequately ‘freeze’ the motion into K consensus volumes.

If you are interested in the relative motion of the three repeated units, I would try:

  • 3D Variability Analysis. The motion should be quite clear in one / multiple components. You can try clustering in these components, but I suspect you may run into similar issues as 3D class. The ‘simple’ mode (which decomposes the linear subspace into ‘frames’ along each component) might give you a nice animation of the overall motion. However, in this case, stepping along one of the components may only show part of the whole story. So I would also try:

  • 3D Flex – which may help not only visualize this non-trivial continuous heterogeneity, but also ‘undo’ this flexing into a single higher-resolution ‘canonical’ volume (in a similar way to local refinement; which may also be useful here).


P.S., a general note on refinements (quite lengthy, hopefully useful!).

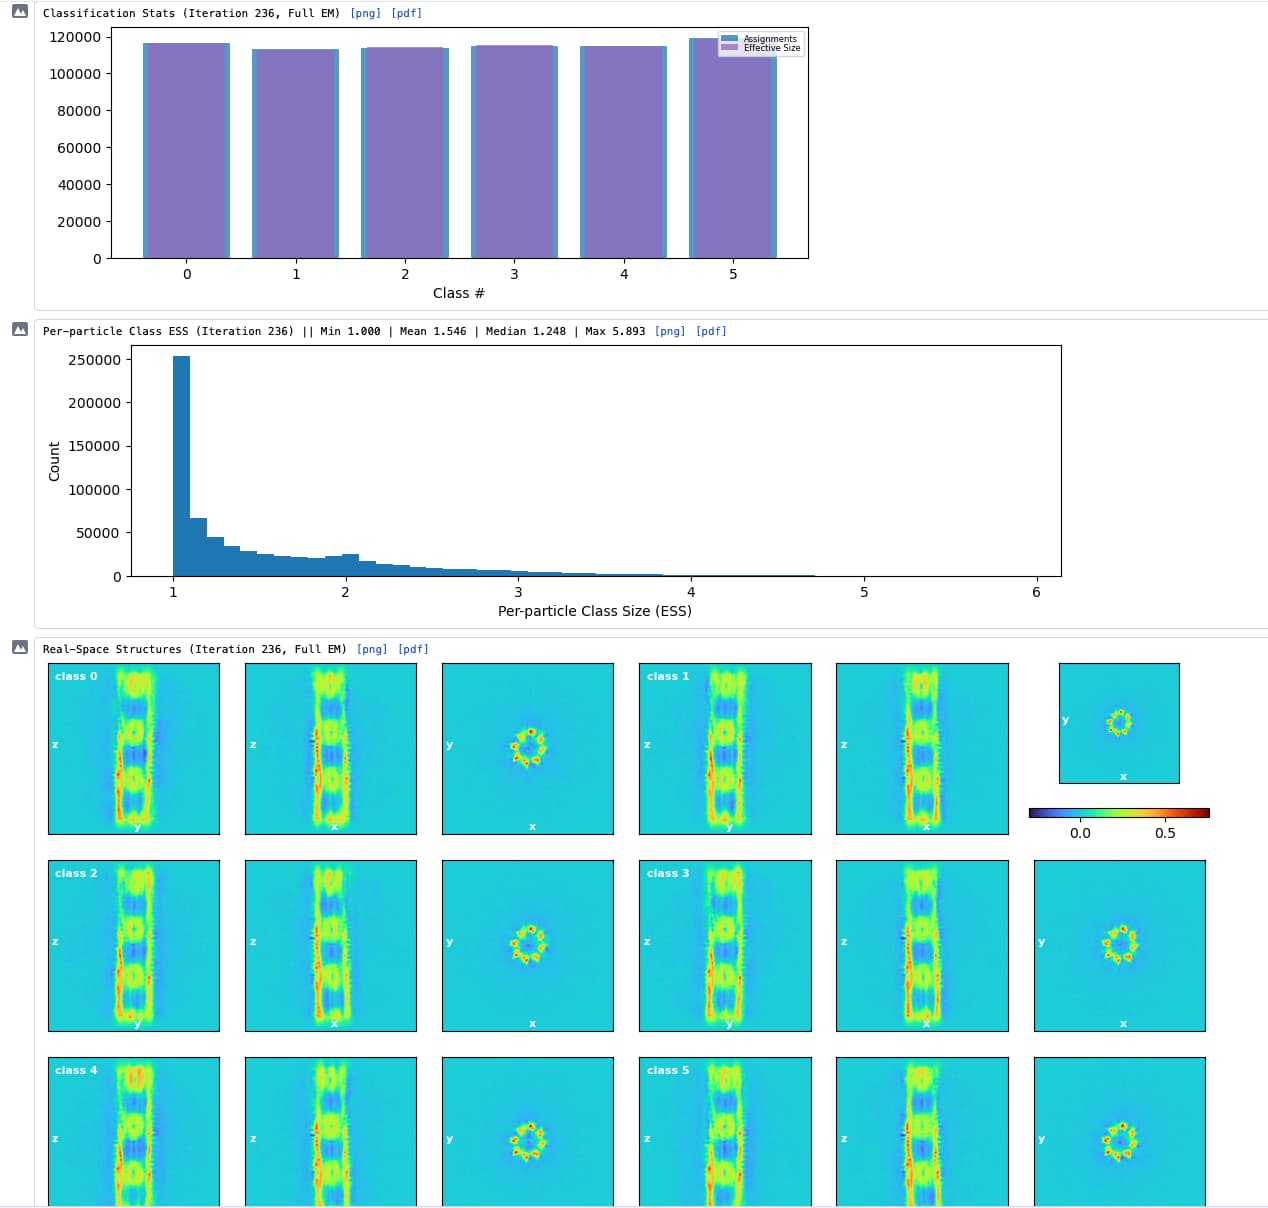
In all three of these jobs we assume that alignments are fixed and proceed to absorb all of the heterogeneity into a more general model of density (i.e., K classes, a linear subspace with K directions, or a non-linear neural-network-based deformation of a canonical volume, respectively). However, in reality, the heterogeneity will be factored into both the map and the alignments – a projection of a continuously deforming structure does not have an ‘alignment’ with respect to a single fixed volume as we usually understand it (i.e., there is no high-res fixed consensus structure and therefore no accurate alignments). In general, the alignments are a ‘nuisance’ parameter – we really care only about the quality of the final map.

As a result, re-refining will not always produce ‘better’ alignments. If one runs classification without alignment, and then re-aligns within a class, the latter step can ‘revert’ the process of the former. This might explain the more ‘diluted’ structures you describe. Since each of the K classes contains multiple states along the continuum, re-refining the alignments assuming a single consensus might reduce the quality of the map.

N.B., iterating classification / alignment can help if there is sufficient signal in each class, and is the basis of classification with alignment (or Heterogeneous Refinement, as we call it). In your case, however, you’d probably need quite a few classes to resolve this motion, which then reduces the signal per class, and probably leads you back to 3DVA / 3DFlex which absorb heterogeneity into a non-static map rather than assume K clusters of consensus structures and associated alignments.

8 Likes

Hi @vperetroukhin, thank you very much for your interest and valuable recommendations.

I have been following your lead trying to get the best out of this dataset and now I dramatically improved the quality map though not so much the GSFSC. Specifically, I first re-run 3D classification tuning class similarity to 0 as well as forcing hard classification. The outputs’ volumes from 3D classification were used to run heterogeneous refinement and, afterwards, the particles assigned to the volumes (from heterogeneous refinements) were used to run helical refinement jobs. This workflow improved the resolution from 6.3 to about 5.7A (not much) and the map looks much more detailed. Another parameter that helped a lot has been dynamic mask near and far of helical refinement job from default to 1 and 3 (more tight), respectively.

I’m not sure why I can’t push any further. The structure is stuck to ~5.7A (GSFSC) using 83K particles with a box size of 256pix and pixel size of 1.62A (F-cropped from 512pix as box size and pixel size of 0.81A). Unfortunately, re-extracting (re-centering using alignment shift option activated) with box size of 512pix and pixel size 0.82A (data without F-crop used previously), worsen the GSFSC back to ~6.2A and the map quality.

I wonder if there would be any other strategy to implement here.

Screenshot 2023-10-05 at 2.52.56 PM
Screenshot 2023-10-05 at 2.56.55 PM

Quick update!

Such 83K particles underwent 2 rounds of Local CTF refinements and right now the GSFSC is about 4.44! Accordingly, the map quality improved.

Screenshot 2023-10-06 at 2.34.44 PM

FSC still looks a bit odd, especially that spike at 5Å - might be worth trying global CTF refinement (beam tilt only) to see if perhaps there is severe beam tilt present.

Was the data collected with stage tilt? If not it is a little surprising that defocus refinement would improve it to such an extent.

Hi @olibclarke, thank you for the interest.

The data collection was without stage tilt. I tried global CTF refinement and used the output particles to run helical refinement but the GSFSC looks about the same. As you can see the is still a spike at 5A. I wonder whether there is anything else I am missing.

Screenshot 2023-10-09 at 2.02.04 PM

I noticed that such GSFSC spike occurs towards the latest iterations. For instance, it08 GSFSC doesn’t have it. Can it be due to an high number of extra final passes (10)?

Screenshot 2023-10-09 at 2.06.51 PM

Hi @lorago92,

I would say yes, the spike at 5Å could be an indication of some kind of overfitting/overrefinement. I haven’t seen it before, but it could be specific to helical refinement.

Regarding the improvement you see with per-segment defocus refinement, I find such a large improvement quite surprising (we typically see ~0.2-0.4Å improvement even for large particles in thick ice), which is why I was wondering if it was collected with tilt (which would give a larger expected range of defocus). Given that it wasn’t collected with tilt, I would maybe double check that all the initial microscope parameters are correct (pixel size, Cs, voltage), just in case.

Cheers
Oli

1 Like

Hi @olibclarke,

Reflecting about the defocus error landscape, I see an interesting behavior (graphs attached) for some of them with a large error. I guess it might be partially explained by the fact that such fibrils really like thick ice hence the data collection has been focused on those areas.

1 Like

Interesting! This would imply that you have >200nm thick ice (bc you have 100nm errors in both directions and your fibrils have non-zero diameter).

If that is the case, then that would certainly explain both the improvement from defocus refinement and the relatively limited overall resolution.

It might be worth trying either additives (e.g. high CMC detergents) or a thin carbon/graphene substrate to try to get your fibrils into thinner ice?

2 Likes

Unfortunately, I already tried to process a dataset in which the grid had an extra layer of carbon (2nm) but it didn’t go well. The dataset I’m processing right now has some low percentage of detergent.

Do you think your ice is really that thick though? 200nm is very thick - should be a very obvious and prominent water ring in the PS, and very high relative ice thickness values (>>1.1) if that is the case

I think it’s thick but but not too much meaning that fibril-like or filaments, for example microtubule, usually have this kind of behavior.

As you can see attached, I selected a relative thickness from 1 to 1.1

right - that is on the thick side, but not that thick - I would be pretty surprised if it corresponded to the 200nm suggested by the per particle defocus refinement… puzzling…

1 Like

This is one thing I like about the RELION diagnostic output for per-particle defocus - by colour coding each particle variance on a plot of the “micrograph”, it’s easy to see when something is “off” - I suspect that if the defoci were plotted (coloured by variance from micrograph mean) that particles immediately next to each other would be wildly disparate defoci (which with a fibre would be impossible).

I’m not sure how to do it directly from the .cs files, but if OP exports the particle stack and converts to .star, then plots positions/defocus with Matlab/Octave/Python/whatever it should show if my suspicion is correct. Even just sorting by coordinate in starparser then checking U/V defocus should show any really pathological defocus shifts.

1 Like

Hi all,

I have a quick update and additional questions about the quality of my reconstruction.

After rounds of 3D classifications and 3D hetero refinements, I further managed to select about 40K particles where helical refinements have yielded the following structure (GSFSC is also attached). Although I start to see nice alpha helical features, I have noticed that when I decrease the density threshold the backbone density results a bit fragmented. Is that normal? Can it be due a wrong mask? For example, here I used the attached mask (yellow) that was used as static during helical refinement. When I use the same mask as dynamic with mask near and far values which were either loose or tight, the resolution drops to ~6A with the map getting worse.

Screenshot 2023-12-04 at 12.48.00 PM

I also considered this issue might be due to inherent flexibility of the structure. In order to test whether this fragmentation of the density was due to highly flexibility of the protein, I performed 3D flex analysis. As you can see attached (3D flex reconstruction in purple), 3 latent dimensions didn’t resolve quite the motion. Would you recommend to increase the latent dimensions?

Screenshot 2023-12-04 at 1.11.58 PM

1 Like

If you wish to investigate the difference of per-particle defocus from the micrograph mean, this jupyter notebook ought to do what you’re looking for!

2 Likes