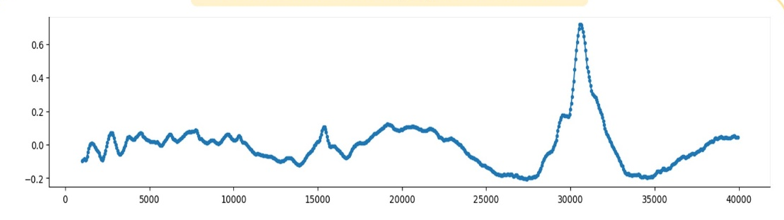
This is the plot of “1D search over varying defocus values”. I know that the x axis is Defocus values (A) but how do we label Y axis of this plot?
1 Like
It appears to be some sort of correlation, because the peak usually matches the estimated defocus below it.
2 Likes
@wtempel , could you please help answer this?
Correct. I checked with our team: the y-axis a normalized correlation between simulated and experimental Thon rings, with the peak at the estimated defocus.
2 Likes