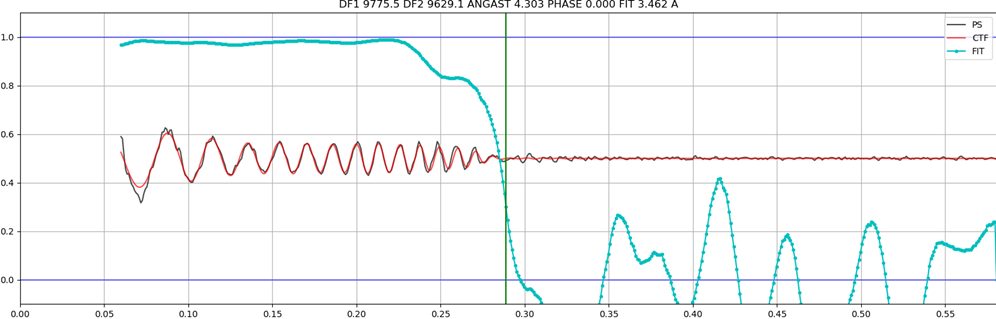
PS=Power spectrum (1D average)
FIT= correlation between PS and CTF model
An electron microscope, when it takes an image of a sample (specifically at some defocus), does not reliably transfer all of the information in that sample. From Wikipedia:
The contrast in HRTEM comes from interference in the image plane between the phases of scattered electron waves with the phase of the transmitted electron wave. When an electron wave passes through a sample in the TEM, complex interactions occur. Above the sample, the electron wave can be approximated as a plane wave. As the electron wave, or wavefunction, passes through the sample, both the phase and the amplitude of the electron beam is altered. The resultant scattered and transmitted electron beam is then focused by an objective lens, and imaged by a detector in the image plane. Detectors are only able to directly measure the amplitude, not the phase. However, with the correct microscope parameters, the phase interference can be indirectly measured via the intensity in the image plane. Electrons interact very strongly with crystalline solids. As a result, the phase changes due to very small features, down to the atomic scale, can be recorded via HRTEM.
In this image, PS is power spectrum, which is simply the computed frequency components of the image in a single dimension. It’s computed by radially averaging the Thon rings in the transfer of a micrograph. It oscillates like that because the contrast transfer is uneven. Think of this as the experimental data.
The red line (Fit) is a computational model that fits several terms (spherical aberration of the microscope, acceleration resultant wavelength of the electrons, and the defocus of the image) to try and solve for errors in the contrast transfer of the projection image of the sample that you take with the microscope. This is crucial because the images collected at defocus contain these errors that must be corrected, including, for one, estimation of true defocus.
The vertical green line shows where the fit drops below 0.3 (the Y axis is the fit score, I assume of cross-correlation). That is the spot at which cryoSPARC “calls it” essentially, and to my knowledge, does not consider data past this because it cannot be reliably corrected. i.e., the vertical green line is the resolution at which the image can contribute useful data. The X-axis is reciprocal space, and extends out to nyquist frequency for your collector.
In this image, the data is reliably corrected out to 3.4 Angstrom resolution.
Your answer is very clear,Thank you very much!