Could anyone please let me know what is the unit in x-axis of this plot? Looks like Y axis is in Angstrom though.
Thanks!
Hi @Ashwin-Dhakal ,
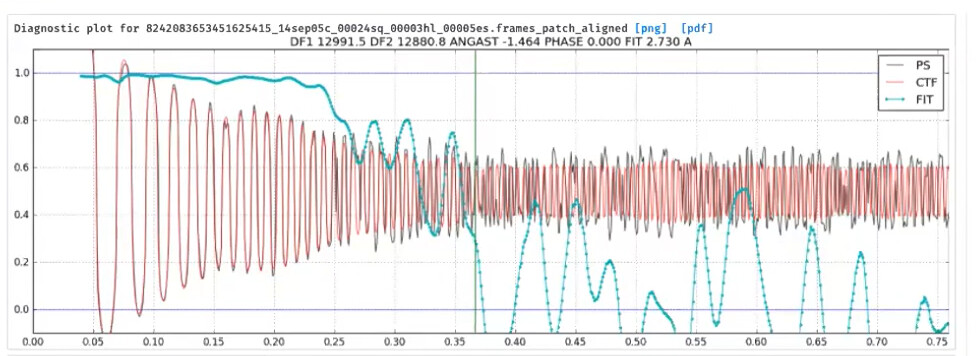
The x-axis displays frequency, in units of in inverse angstroms (Å⁻¹). The y-axis is in dimensionless units; it shows the value of a correlation metric (“FIT”) between a re-scaled micrograph power spectrum (“PS”) averaged over a given frequency band, and the CTF value (“CTF”) at that frequency band.
Best,
Michael
3 Likes