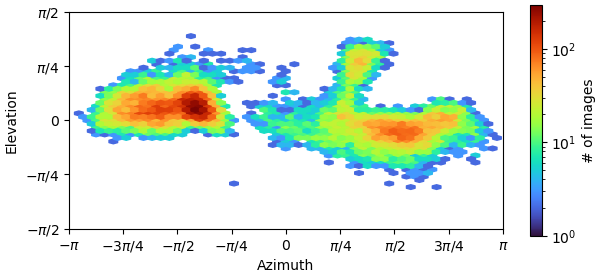
in one of our datasets, the sample shows a strong preferred orientation, represented by the poor viewing direction distribution. However, the final reconstruction after Homogenous Refinement appears fine. The map does not appear distorted or streaked along any viewing direction.
My question is: How do you assess whether enough views have been sampled? Do I have enough views if my refinement looks nice, no matter how bad the viewing distribution looks? How bad is too bad?
Have you run Orientation Diagnostics? This gives some additional diagnostics which are useful for answering this question (cFAR, SCF* in particular). In general though I would tend to say that if the density looks undistorted and interpretable, then you are probably fine.
With two small breaks, there seems a reasonably well sampled “belt” around the equator. Definitely run orientation diagnostics, but if the map looks OK (no density streaks, features on par with what are expected for a given resolution) then it should be fine.
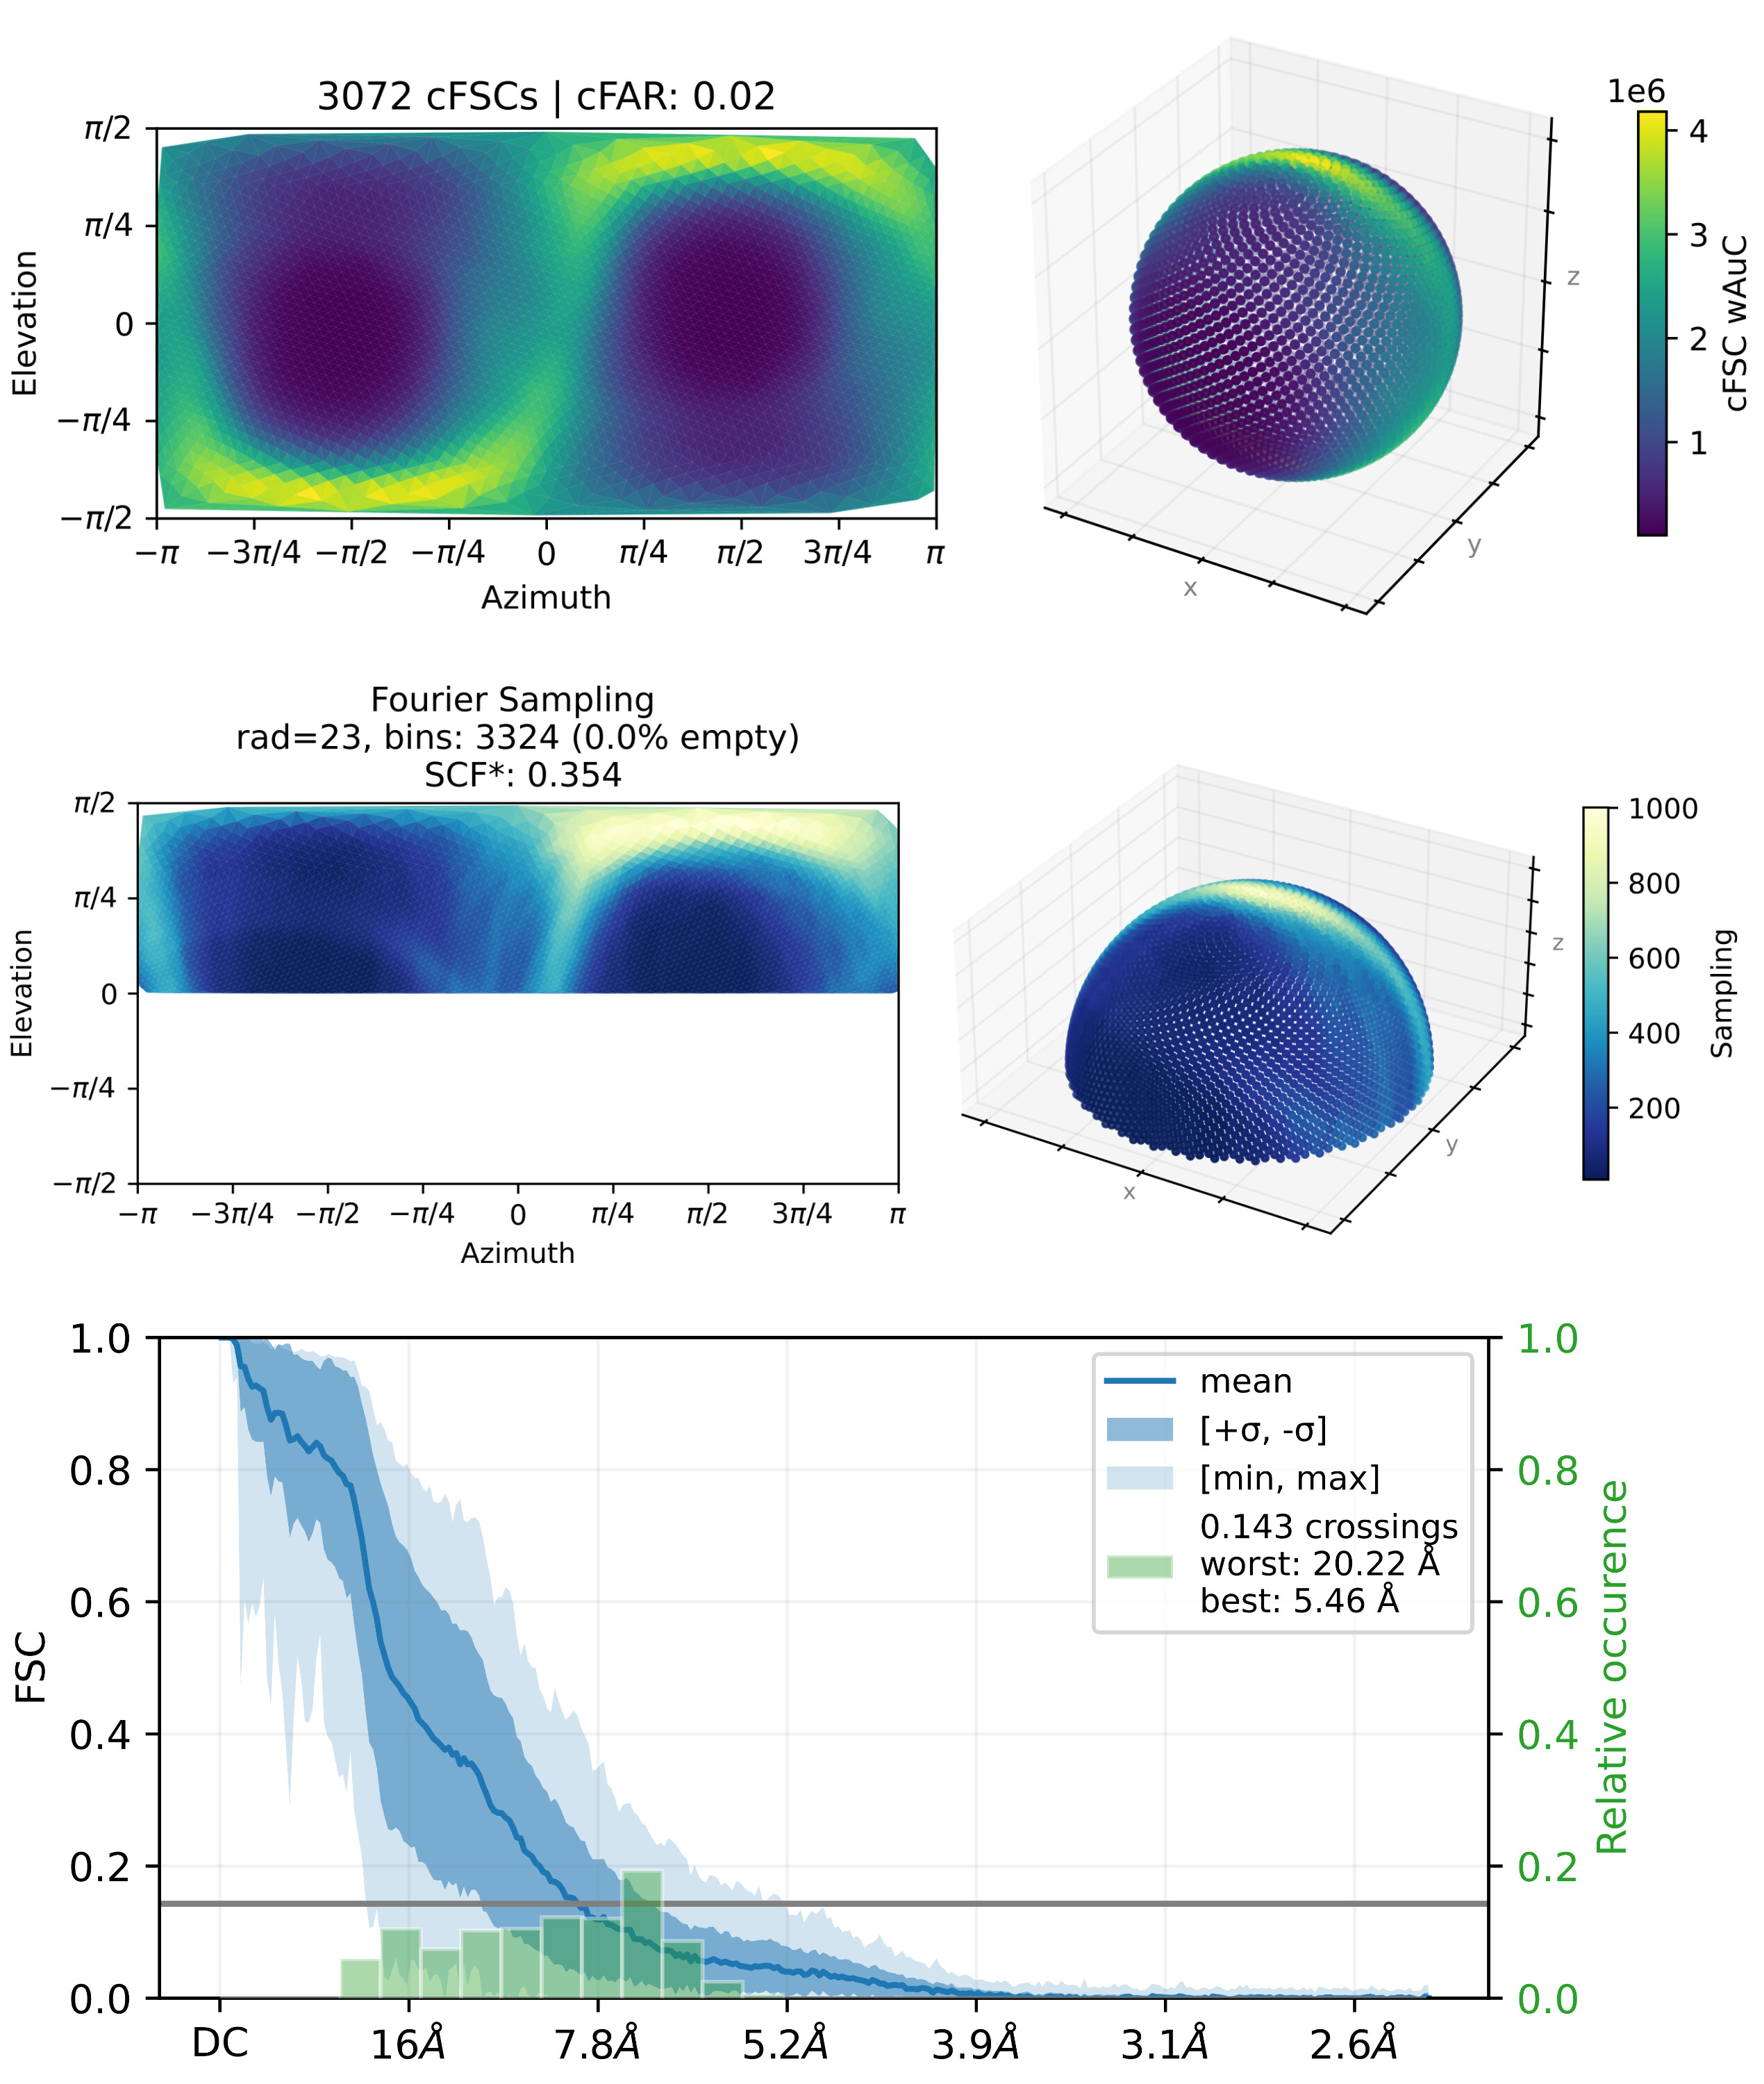
I ran Orientation Diagnostics and put some output plots below.
The orientation bias is quite severe with a cFAR of 0.02, a SCF* of 0.354 and a cFSC resolution of >20Å in the worst case.
While the refined map from Homogenous Refinement claims a maximum resolution of 3.82Å, the map does not appear to be this well resolved. Nonetheless, it does not appear distorted and is good enough to build a model.
When publishing the data, should I also supply the summarised cFSC curve with the “best” and “worst” resolution together with the FSC curves from Homogenous Refinement, or is this not strictly necessary, despite the discrepancies between the two?
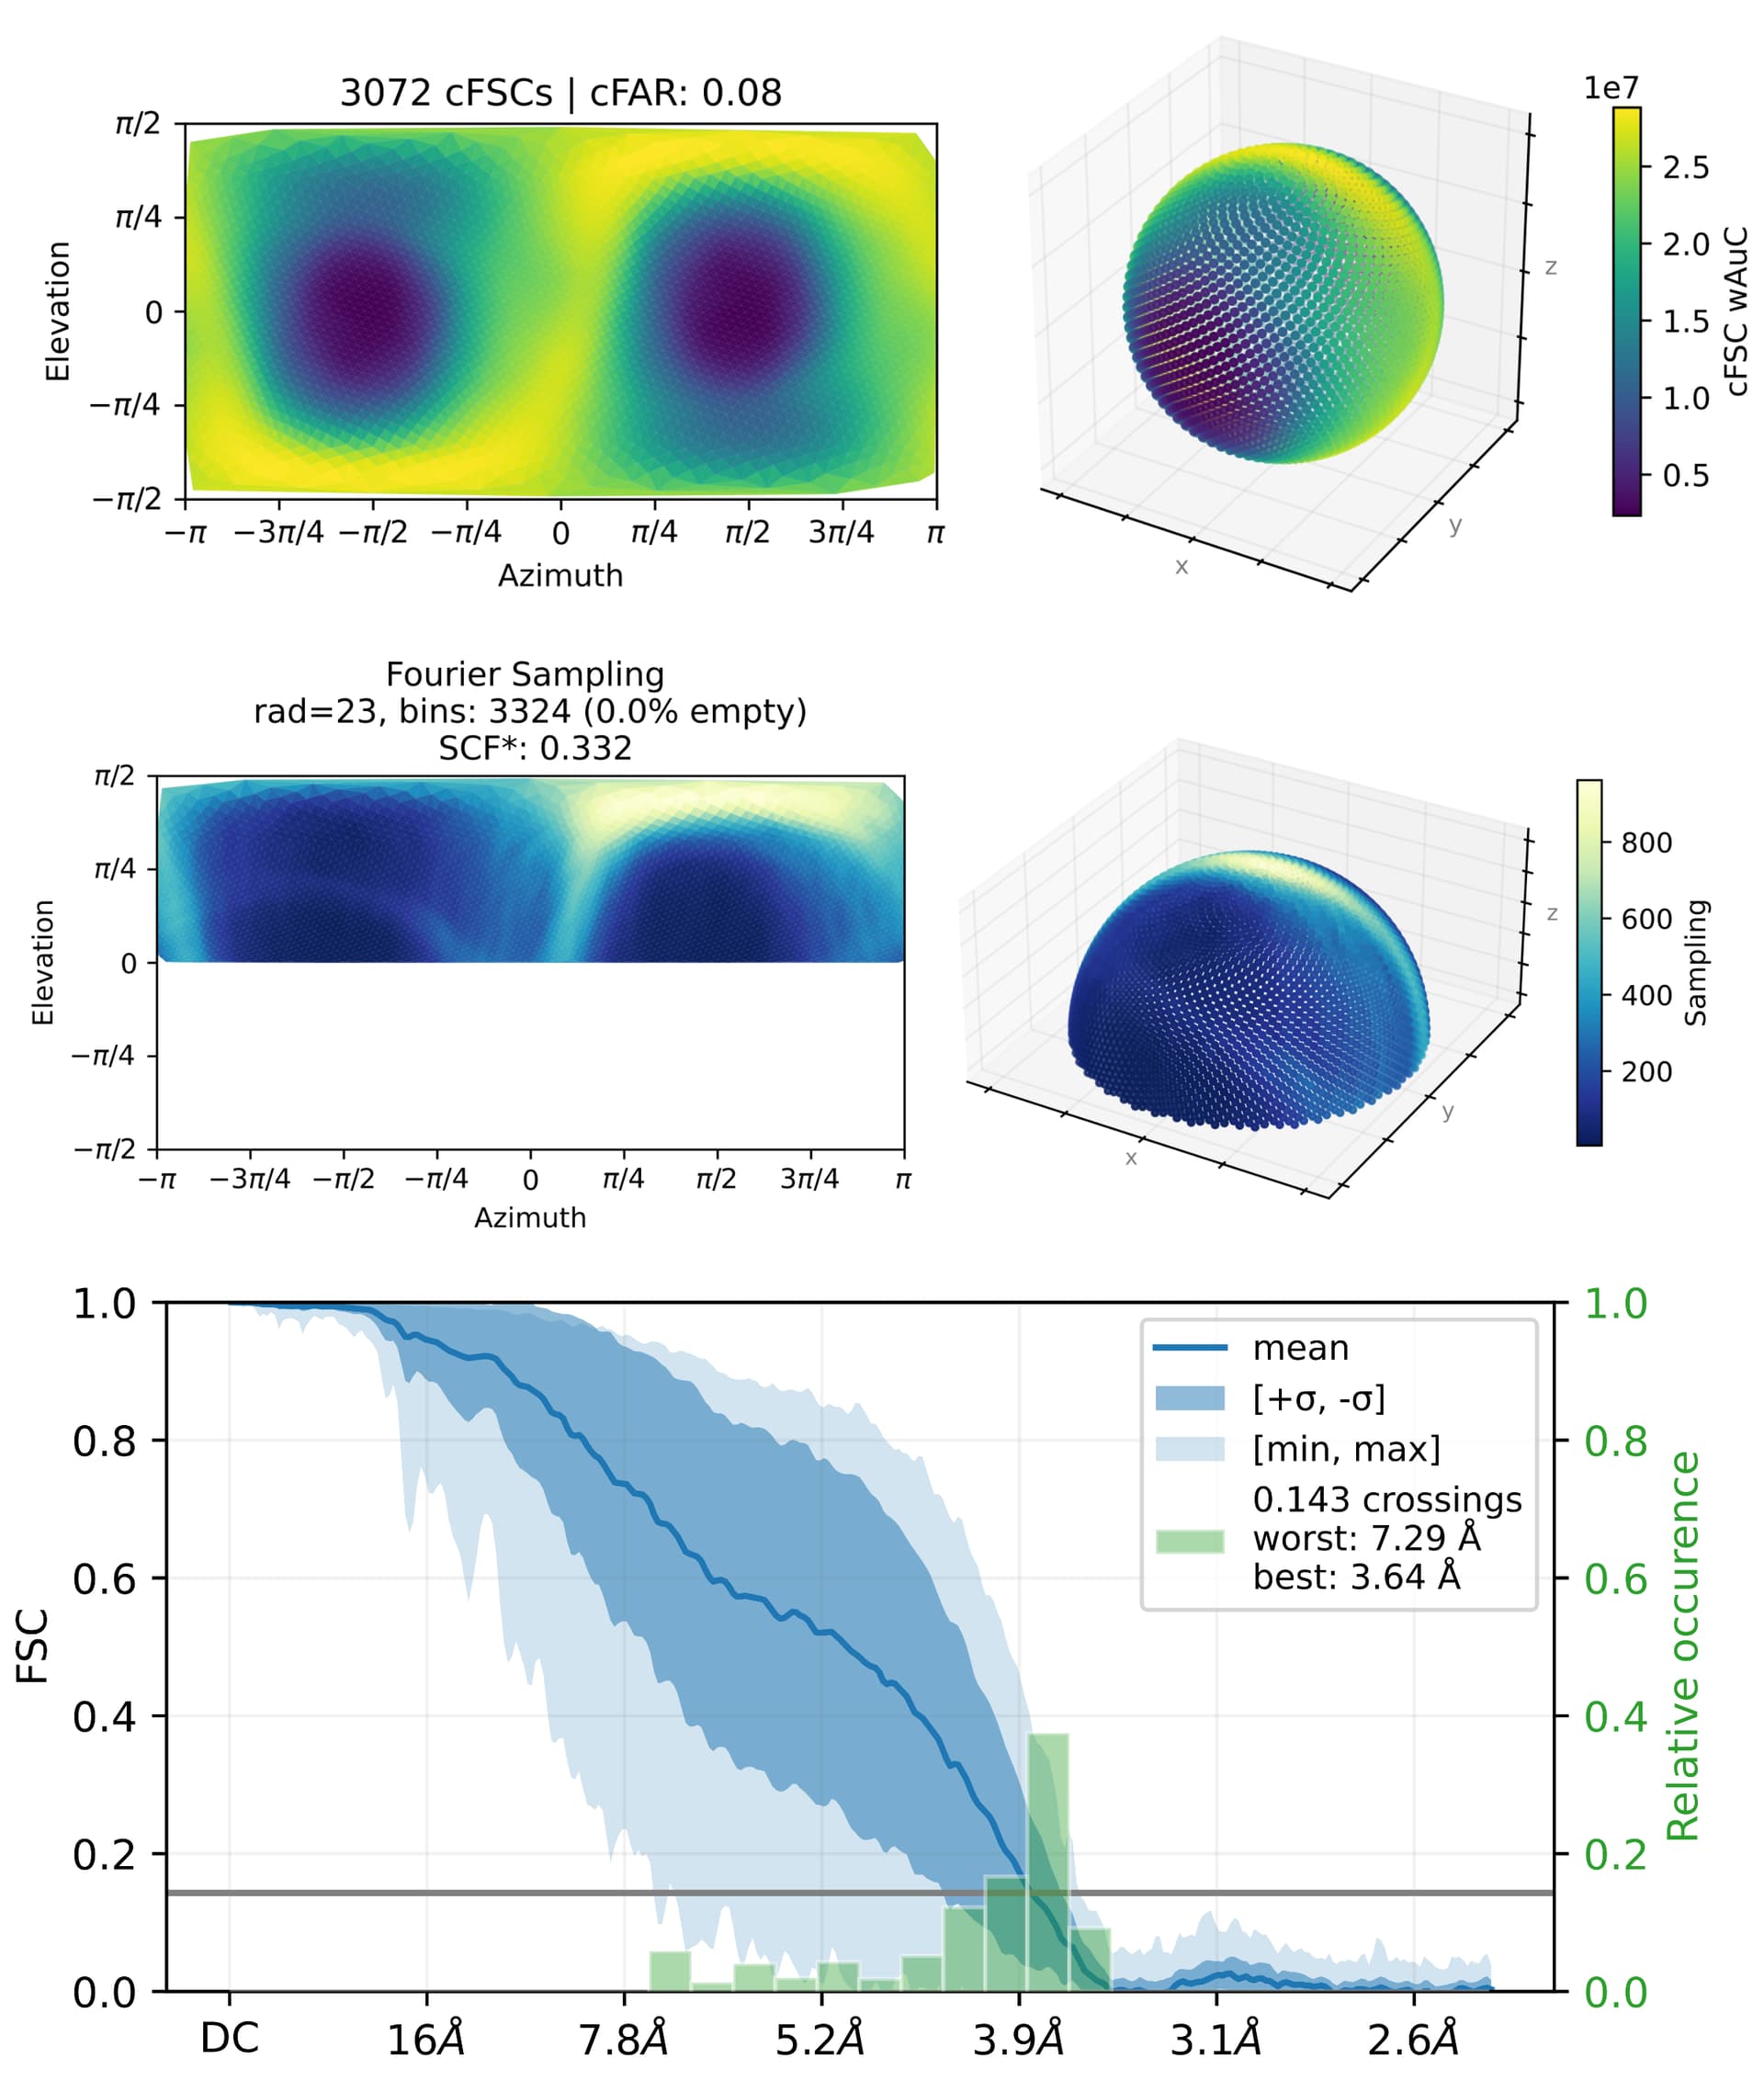
Definitely better! I would still expect some degree of density anisotropy based on these plots, but as long as the map has good backbone connectivity and bulky sidechains are well defined and can be confidently modeled, I think you’re ok. As per usual, it will depend on exactly what question you are using the structure to address.