Hi all,
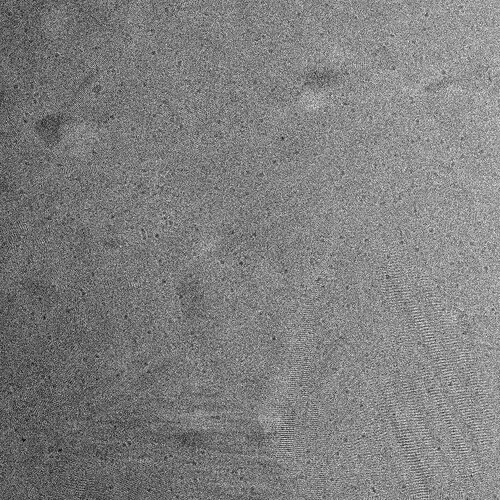
This is a micrograph of my sample, collected in Falcon 4i, 300 kV, pixel size 0.74, dose 50 e/A2.(Gain Reference was done during expt.)
I do not understand why there are some lines on micrograph (extensively on right below of the M).Can anyone suggest what is the wrong while collecting this data ?
Crystalline ice. You are seeing the lattice planes of the ice crystal which is pretty cool! Take a look at the FFT, too
Thank you for your reply.Will it bring problem while data processing? I am curious whether it will prevent to have better 2D or 3D.
well, if most of your images are like this then that likely indicates an issue with vitrification (blot time or cryogen temperature).
Also, crystalline ice is often (though not always) associated with thicker ice, which will certainly make processing more difficult.
More of an issue though is that the (non-ice) particles in this image are very, very small - is that expected? What size is your target?
Hi olibclarke,
Thank you for your explanation. The expected size will be 8 nm.I am in the stage of initial screening.
