Hi @mjmcleod64! These are great questions about Topaz! I’ll do my best to guide you in the right direction here, but there are some great resources in our guide and in Topaz’s documentation and paper as well!
Precision plots
What is precision?
Precision, in this context, is the number of correct particles your model found divided by the total number of particles your model picked. Some examples:
- A model which correctly identified 10/10 particles and did not pick any non-particles would have a precision of 1.0
- A model which correctly identified 7/10 particles and did not pick any non-particles would also have a precision of 1.0
- A model which correctly identified 7/10 particles but also picked 3 non-particles would have a precision of 0.70
A more precise model is picking less noise, but it is not necessarily picking more good particles. So generally, yes, a higher number is probably better, but a model which picked only 1 particle per micrograph might get a great score without being very useful!
What is average-precision?
Average-precision is a way of making up for the fact that the precision does not increase as the model picks more good particles. Its direct calculation is a bit more complicated than that for precision, but in essence, imagine that the model first ranks every area of the micrograph by how likely it thinks that area is to contain a particle. The average-precision score is a measurement of how well the model did at correctly ranking those areas.
Training vs. test
If you reserve some of the data for testing, you will see both how well the model performs on the data it was trained on as well as on the test data that it did not use during training. When you reserve a test data set, you should prefer to look at the test precision rather than the train precision.
Precision in Topaz
Remember that Topaz only requires partial labeling. That is, it doesn’t consider things you didn’t label to be definitely not a particle, it just doesn’t know they definitely are a particle. This means it is tolerant of picking particles you didn’t label as long as it’s not picking more particles than you told it to expect per micrograph. For more detail I recommend you check out the Topaz paper, especially the discussion of positive-unlabeled (PU) learning.
So for instance, say a given micrograph in your test set has 100 good particles. However, you only label 50 of those particles. If your Topaz model successfully picks all 100 particles in this micrograph, it would only have a precision of 0.50, but it would actually be performing perfectly.
Your data
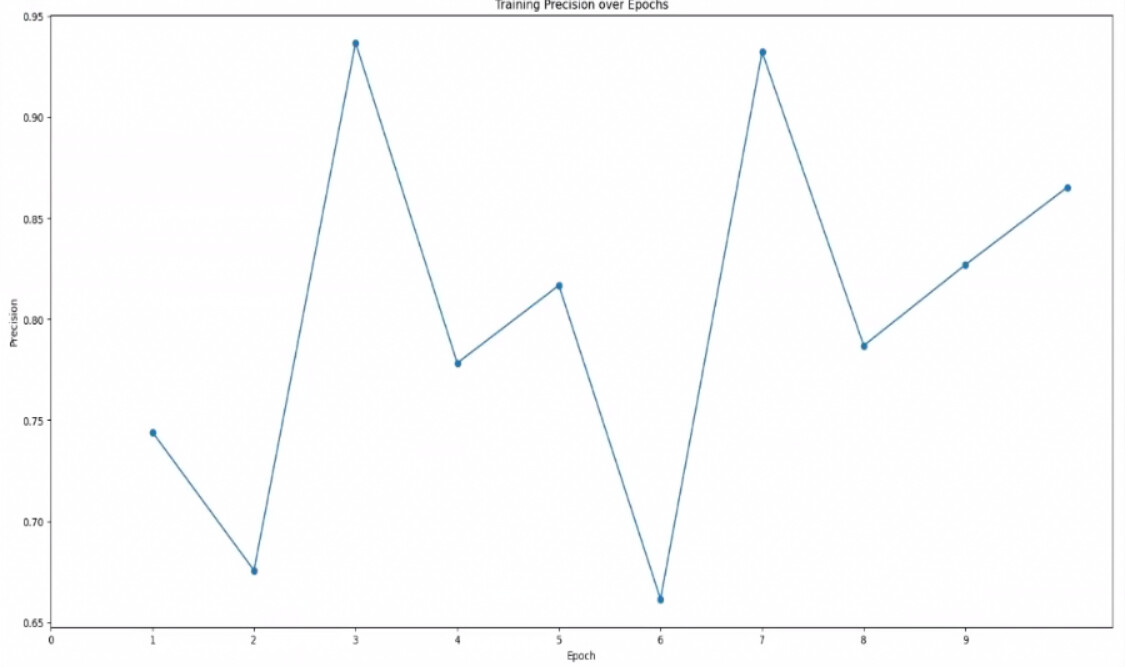
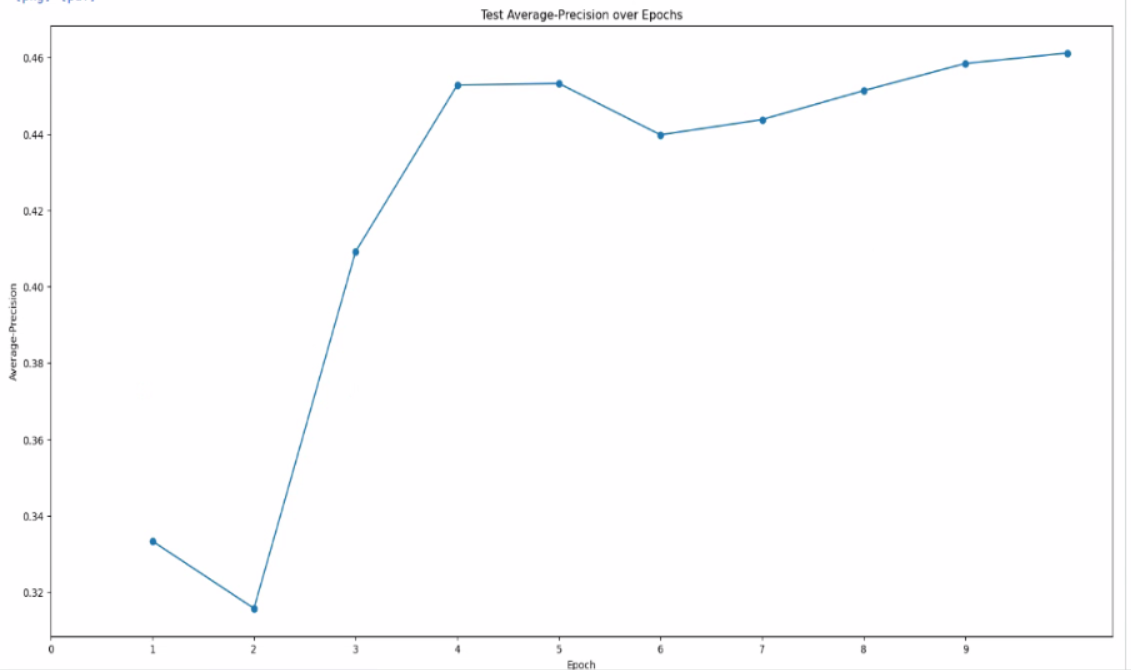
So in your first plot, you get to a precision of 0.95. This means the model is picking very few things you didn’t label. In your second plot, your precision ends up around 0.45. This means that for every particle you labeled in the training set, Topaz is picking about two.
If you think you only manually picked about half of the particles, this is probably good. If you think you labeled all of the monomers in your input data, this might be concerning. I would especially be worried if there are approximately equal numbers of monomer and dimer, in which case it would be possible that Topaz is picking both monomers and dimers even though you only labeled monomers.
Highly heterogeneous dataset
You mention that you’ve moved on to applying Topaz to a highly heterogeneous dataset and are getting very low precision values. This may be alright, provided you do not think you picked every good particle in the training dataset.
If you do think you trained on a completely labeled dataset, this means the model is picking particles you don’t want it to. You may want to consider an algorithm that does not use PU learning, such as crYOLO.
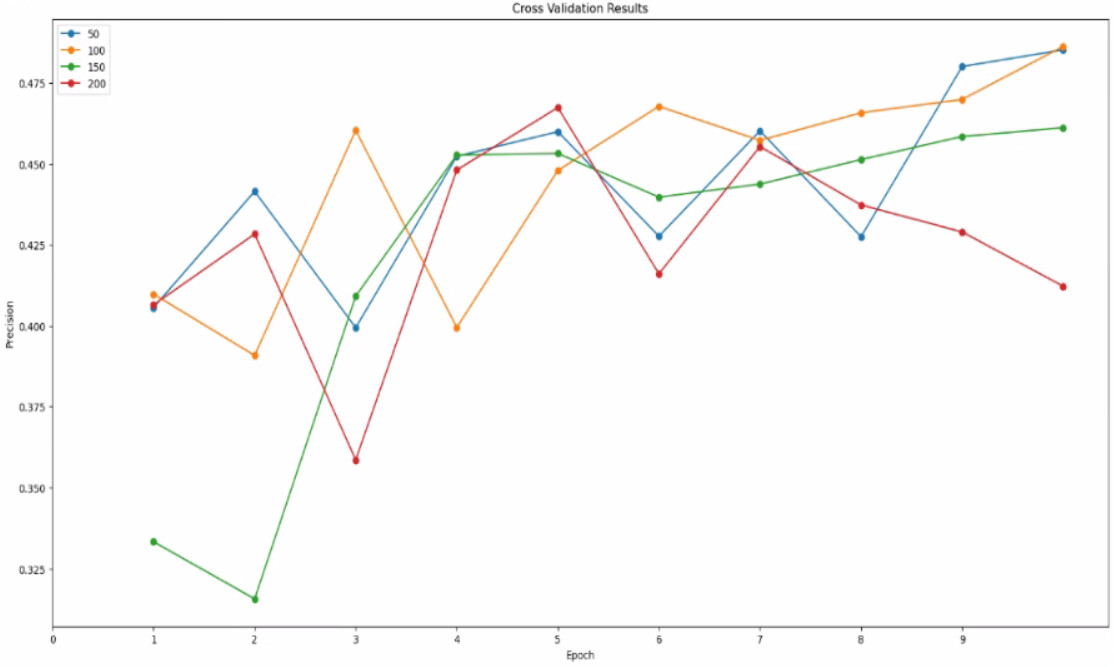
Cross Validation
Yes, if there is no clear winner in the cross validation plot it’s likely that the model is not especially sensitive to that parameter within the range you tested.