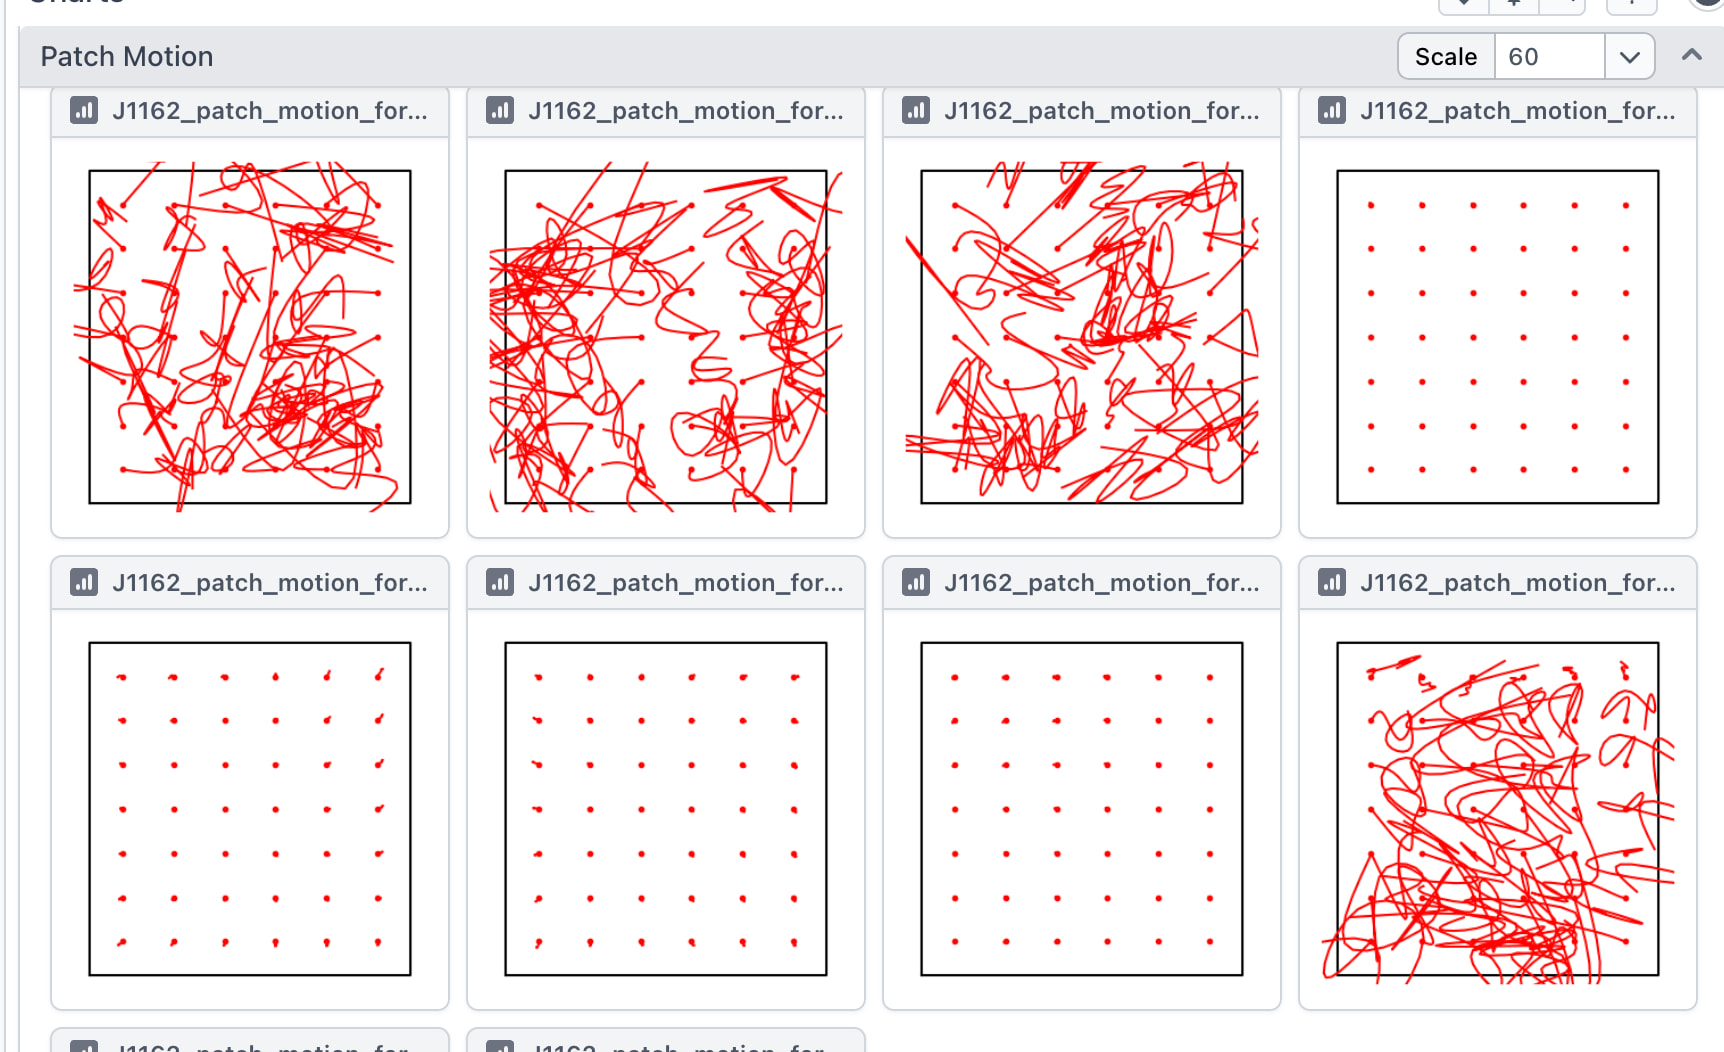
Would it be possible to add a metric for exposure curation that captures the variance between patches/knots within a mic during patch motion? Inspection of the patch motion plots and comparison with the micrographs suggests that it might be a pretty clean way to differentiate between good micrographs and micrographs with no ice or a lot of junk.
Also, an FFT-based metric that reports the max SNR in the ice ring band (rather than the average, as relative ice thickness does) would be handy, as it is an easy way to separate out crystalline ice.
Related to the patches question, are there any metrics such as total motion, local motion curvature, or patch CTF stats that would be more easily suited to the “messy” micrographs. Can you post a couple micrographs, one of the “messy” mic and one of a “clean” mic?
In this particular case it is just reporting on empty holes (no ice) - which can be caught by poor CTF fit, unless there is carbon in the frame in which case the CTF fit will still look ok. In other cases the patch-variation seems to report on the presence of junk, or very thin/breaking ice.
I don’t have local motion curvature as an option in Curate, just full frame motion curvature?
I will see if I can dig up some micrographs - or maybe best is I will see if I can make a proof-of-concept CS-tools script to see if this useful for identifying mics that are otherwise not removed by other exclusion criteria.
In this particular case it is just reporting on empty holes (no ice) - which can be caught by poor CTF fit, unless there is carbon in the frame in which case the CTF fit will still look ok. In other cases the patch-variation seems to report on the presence of junk, or very thin/breaking ice.
Good to know, thanks!
I don’t have local motion curvature as an option in Curate, just full frame motion curvature?
Ah, yes sorry, full frame motion correction. Local is only available after local motion correction and wouldn’t be useful here.
The per-patch trajectories are not stored in any of the output files of PMC, but its possible to use the splines that are output in the job directory. We have a notebook example for deriving per-particle trajectories from patch motion trajectories. Part of this notebook includes the relevant code to interpret the splines and compute the per-patch trajectories.