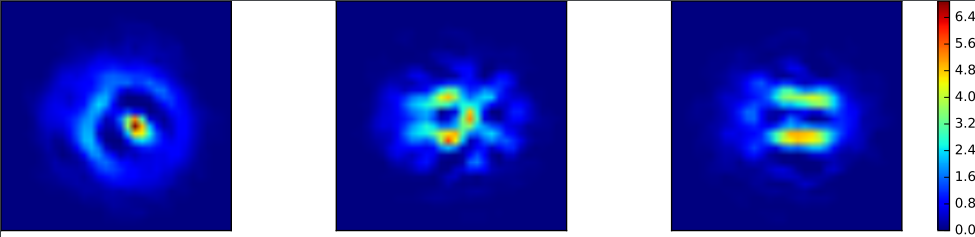
When running through the iterations, cryoSPARC shows what are seem to be “thermal” maps for each class as shown below. Associated with each of the maps there is a scale where the values differ with each class and with each iteration. Can anyone enlighten me on what this scale actually means and why do values differ with each class and iteration. Please and thank you.
Hi @Cper13, the heatmaps are just coloured represenations of 3 axis-aligned slices of the density (xy, yz, zx) and the colorbar on the right shows the actual density values that the colours represent. Most other programs display density slices in greyscale but we prefer making colour plots.
Over iterations and across classes, the min and max density change for each structure, so the scale on the colorbar changes also.