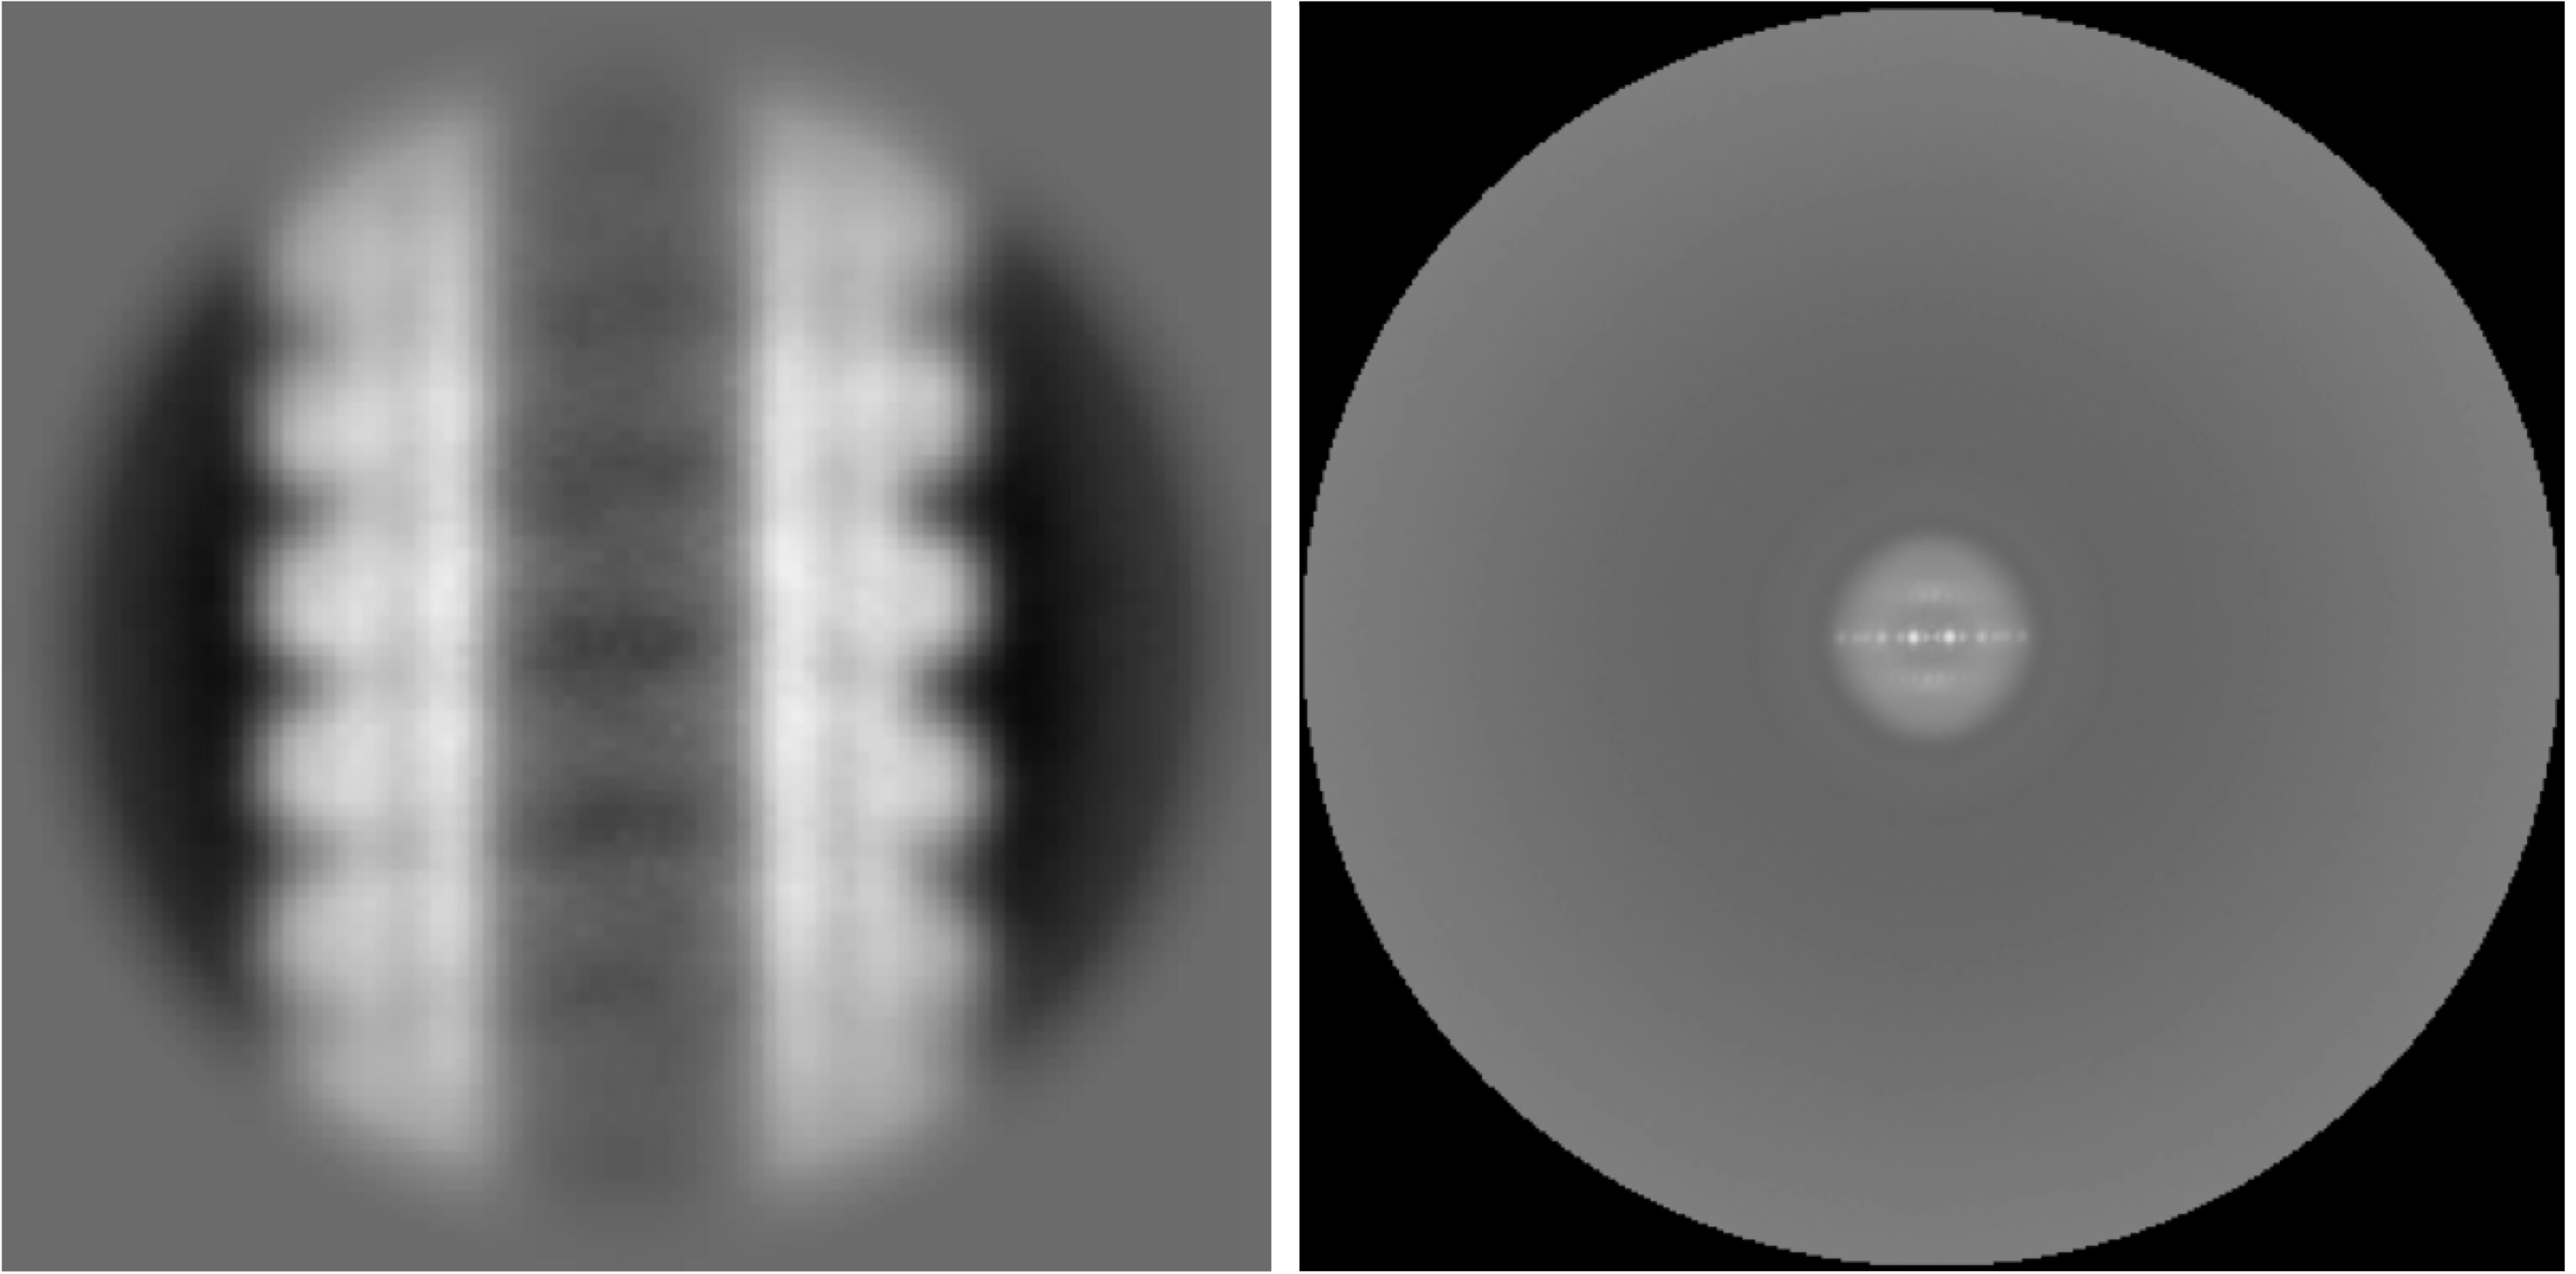
I used the new power spectra tool in the recent version of cryosparc on helical 2D classes. To calculate the helical parameters from the power spectra I need the scale of the power spectra: 1 pixel = how many angstroms. How do i find out the scale bar of the power spectra generated by cryosparc?
The output power spectrum and its cs file are written to the job directory of the Average Power Spectra job. You can locate the cs file of the power spectrum there, then examine the field labelled power_spectra/sample_spacing_inverse_A. This contains the sample spacing (i.e. the size of one pixel) of each power spectrum, in units of inverse Angstroms. Here’s a link to a tutorial on how to read (and manipulate) cs files using the command line.
I am also using the PS tool in cryosparc and I am wondering if it is possible to make intermediate steps easier to be applied.
Can the resolution of the PS, i.e. the pixel size which is really mandatory to analyse the helical parameter in Helixplorer, be directly shown or can the original pixel size be kept? Despite the detailed description of how to get the pixel size from .cs-files as well as to manipulate them, I could hardly reproduce it.
If running the “Average Power Spectra” Job on several classes at the same time (e.g. from a 2D classification job), the output will be one single png-file including all figures. This could not be directly loaded into the Helixplorer. One can get, of course, single jpg-files from the mrc-file using external ImageJ. But it would be much faster if the output contains every single image of a single power spectrum.
Please excuse my unsophisticated views, all the requested information from getting a power spectrum is available in the cryosparc job. These are just ideas to make using the output of this job type a bit easier.
Thank you!
Welcome to the forum and thank you for the requests. Since our last post on this thread, we have released CryoSPARC Tools which is a python library that allows for interfacing with CryoSPARC, including reading and assessing outputs, running interactive and customized jobs, and displaying/writing outputs. You may be interested in this package as it facilitates reading cs files; check out this example as a walk-through for how to use cs-tools to create high-resolution images of 2D classes (which may be helpful for your second question – see the end of my reply).
To address the first question – it would certainly be a good addition to include the sampling spacing of the power spectra in the streamlog for convenience. Since the power spectra are in Fourier space, the sample spacing is in inverse Angstroms as indicated above. As well, note that the relation between the sample spacing of the power spectra (sample_spacing_inverse_A) and the pixel_size (in Å) of the realspace images that generated is as follows:
sample_spacing_inverse_A = 1 / (N*pixel_size)
where N is the image box size of the output power spectra. Thus, you can rearrange this to compute the realspace pixel size from the power_spectra/sample_spacing_inverse_A and the power_spectra/shape outputs in the cs file provided from the job. Note though, this is redundant to do, because the real-space pixel size of the underlying particle images used to generate the power spectra is always fixed at the input particle pixel size; there is no way to change this via the average power spectra job. This is because the “2D zeropad factor” parameter simply pads the input particles with zeros; it does not change their pixel size. This is included as a parameter in order to achieve finer sampling of the power spectrum in Fourier space, as it may help to use more finely-sampled power spectra when using external tools like Helixplorer. Instead of all of this, you can look for the input particle pixel size as the blob/psize_A dataset field in the cs file of the input particles.
In terms of modifying the power spectra sampling spacing, this can be controlled by changing the 2D zeropad factor parameter of the job. The output sampling spacing (in inverse Å) will be inversely proportional to this parameter. So for example:
if the sampling spacing at a zeropad factor of 2.0 is 0.001, then the sampling spacing a a zeropad factor of 1.0 will be 0.002.
For your second question, I believe that if multiple classes are input, then png images are output at each checkpoint for the power spectra of each individual class. Can you confirm that you are able to find the PNG images for the individual spectra by navigating to each checkpoint in the stream log? Note that, to be sure that no quality is lost during image compression or download, we still recommend using the mrc files written to the job log and then manually converting them to JPEG or similar. I recommend reading the Generate High-Res 2D Classes tutorial for an example of how to load in mrc files into cs-tools (using the project.download_mrc function); these could then be written to PNG or JPEG at high resolution via matplotlib plotting.
Hi Michael,
thanks a lot for your explanations. I am trying to follow your suggestions. Yes, there are the individual png-files of different PS if going to each checkpoint separately. I always used the compressed view, so I ignored this. Thanks for the hint!
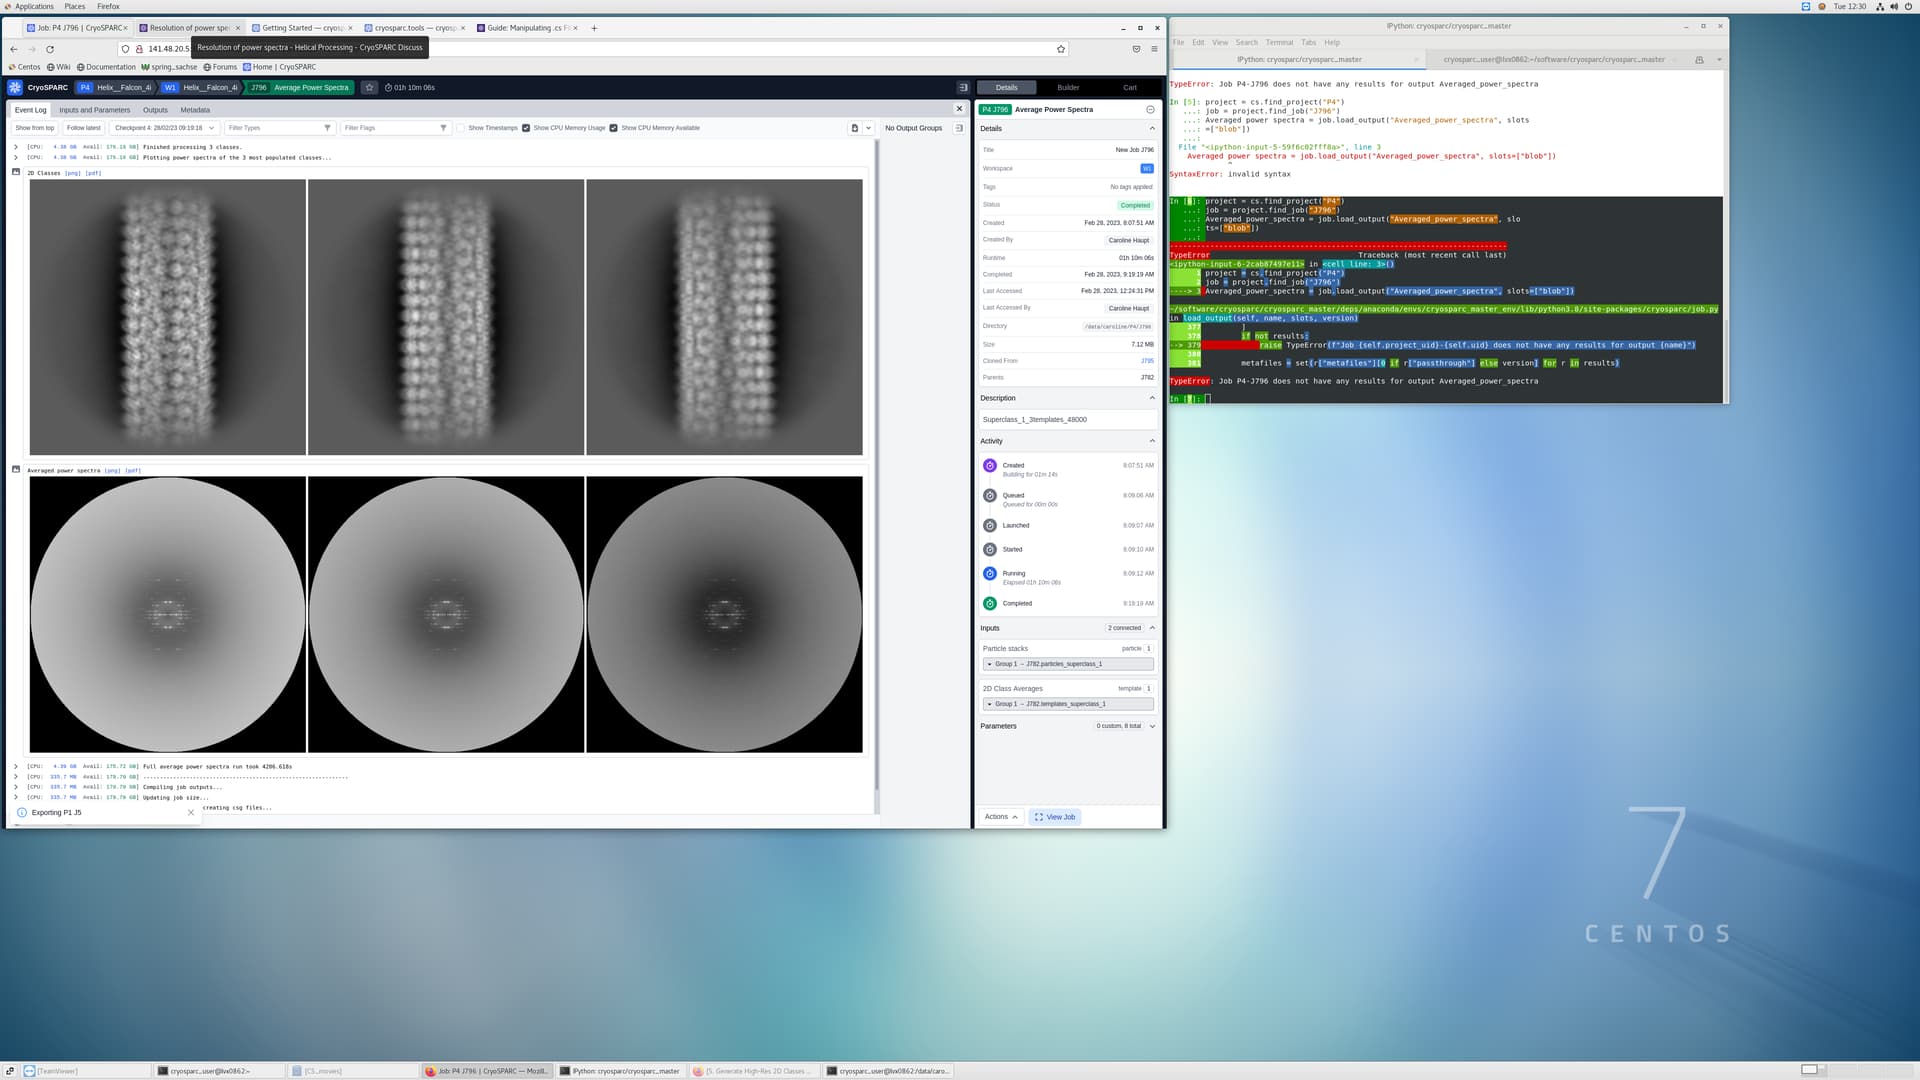
Regarding the .mrc-file-conversion, I follow the instructions in the guide but it says that there are no output files specified as for example in a 2D select-job. Am I missing something? I checked all windows in CS as well as the content of the specific folder but could not find it. Is it named differently? Please, can you see my error message from cryosparc-tools? :
~/software/cryosparc/cryosparc_master/deps/anaconda/envs/cryosparc_master_env/lib/python3.8/site-packages/cryosparc/job.py in load_output(self, name, slots, version)
377 ]
378 if not results:
→ 379 raise TypeError(f"Job {self.project_uid}-{self.uid} does not have any results for output {name}")
380
381 metafiles = set(r[“metafiles”][0 if r[“passthrough”] else version] for r in results)
TypeError: Job P4-J796 does not have any results for output Averaged_power_spectra
Here is also a screenshot of the results view of the respective job.