I am trying to run some ResLog analyses of refinement jobs I’ve made. For my purposes, I would really like to have the error bar to make sure there aren’t any flukes in the particles choices. However, when I check the “Plot error bar” option, it doesn’t seem to produce any erro bars on the ResLog plots? And when I export the text file of the analysis I only see one resolution per mask and particle count. Is there something I’m missing?
Hi @shervinnia, thank you for reporting this! Right now the Plot error bar parameter does nothing – we have taken note of this bug.
As for the reproducibility question, it’s important to note that in CryoSPARC’s implementation of ResLog analysis, the particle sets are reconstructed and the resolution assessed, but they use the same pose they have in the consensus refinement. For this reason, we do not plan to implement the ability to perform multiple ResLog reconstructions and plot error bars, as we feel this may lead to over-confidence in the result.
If this type of repeated ResLog analysis is important to your workflow, you may consider creating a Workflow which runs several ResLog plots in parallel. This has the added benefit of letting you run them in several jobs across several nodes (if you have several nodes accessible to you), which would make the job faster than running them all on one node.
May I ask what you mean in terms of reproducibility? My understanding is that random subsets of particles are selected, and my thinking is that in the reconstructions of lower particle counts (say, in the hundreds or low thousands) there could be a large variability in particle quality. My assumption doesn’t rely on particle poses changing, but rather in the random choice of particles used in the reconstruction.
In this case, an error bar would help not only in assessing particle homogeneity but also in doing comparisons between different types of reconstructions or even datasets (e.g. sample preparation methods changing particle homogeneity/quality).
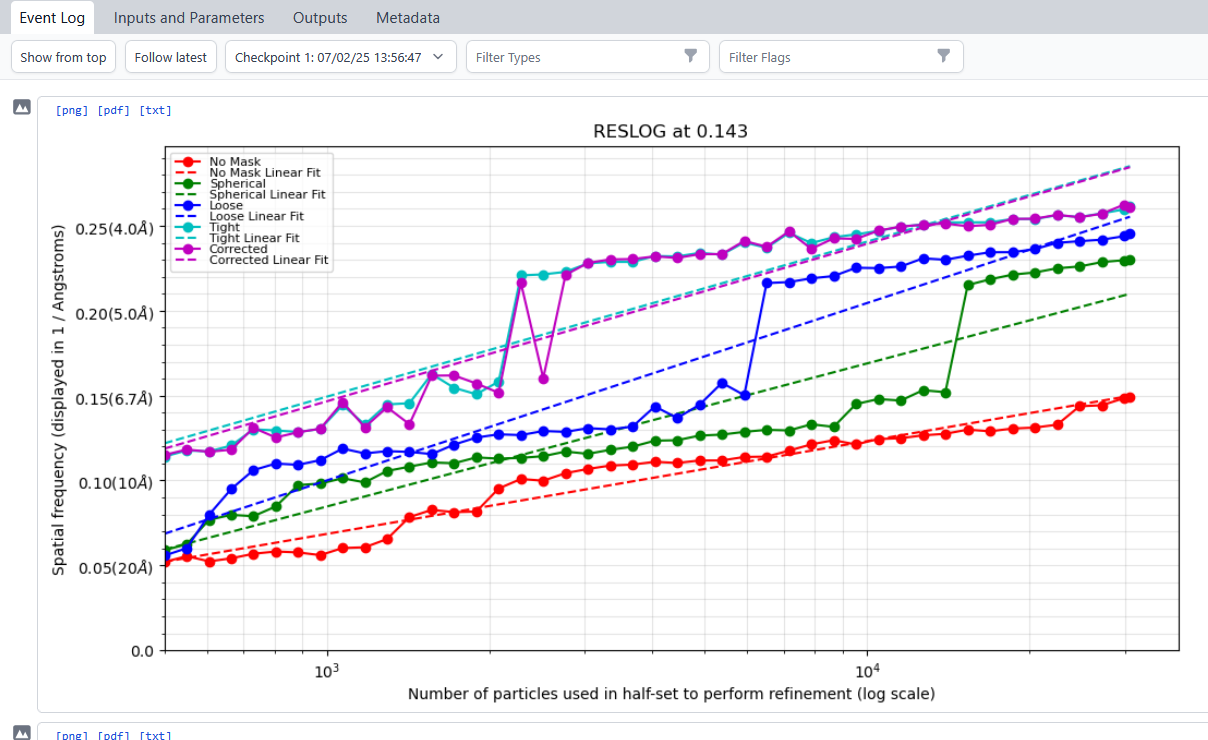
You’re right that especially the low-particle-count reconstructions may have a higher variance. For example, here we see that when I run 10 ResLog analyses of the same dataset, three have unusually low resolutions at the lowest particle count:
However, this does not have an outsize effect on the trend lines (in my opinion).
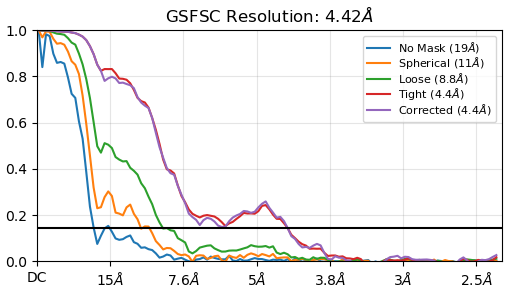
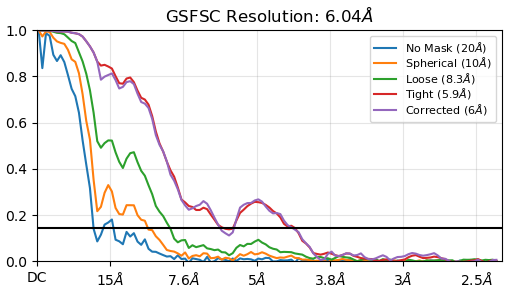
Moreover, inspecting the GSFSC plots themselves, we see that this is likely because of the dip in GSFSC that is commonly observed in membrane proteins. In some subsets, this causes the curve to fall below 0.143, while in most it does not – but only just barely. For example, these two plots are essentially the same, but the top one just barely stays above 0.143 and so claims a much better resolution.
If I were running this analysis, I would re-run this ResLog job with a larger minimum batch size, since I am not confident in the lowest bin’s GSFSC estimate. This is what I was trying to get to with reproducibility – this is largely a qualitative tool for estimating particle quality, and so rather than applying statistical analysis of several runs, we feel that inspection and qualitative analysis of the GSFSC plots is more useful and avoids the appearance of analytical rigor where there is none.
Note that in the two high-resolution papers from 2020 (Single-particle cryo-EM at atomic resolution | Nature and Atomic-resolution protein structure determination by cryo-EM | Nature), the resolution values for the ResLog plots were obtained from independent refinements of the particle subsets, not from reconstruction-only using the poses obtained from refinement of the whole set (as CryoSPARC does). They also ran replicate refinements of each subset, which is how they get error bars (at least as I understand it). When trying something similar, I got final GS-FSC resolutions to differ at the second decimal place, which is negligible. But this depends on how easy your particles are to align.
When refining each subset independently, you definitely see the deviation from linearity in the low number of particles regime, because these subsets no longer benefit from the poses determined from the whole set.
So, if you need to compare your results to other previously reported results, you need to make sure you compute your ResLog plot the same way (reconstruction-only with poses from the whole set, or independent refinement of subsets).
This discussion from last year on 3DEM helped me understand this procedure better: [3dem] B-factors
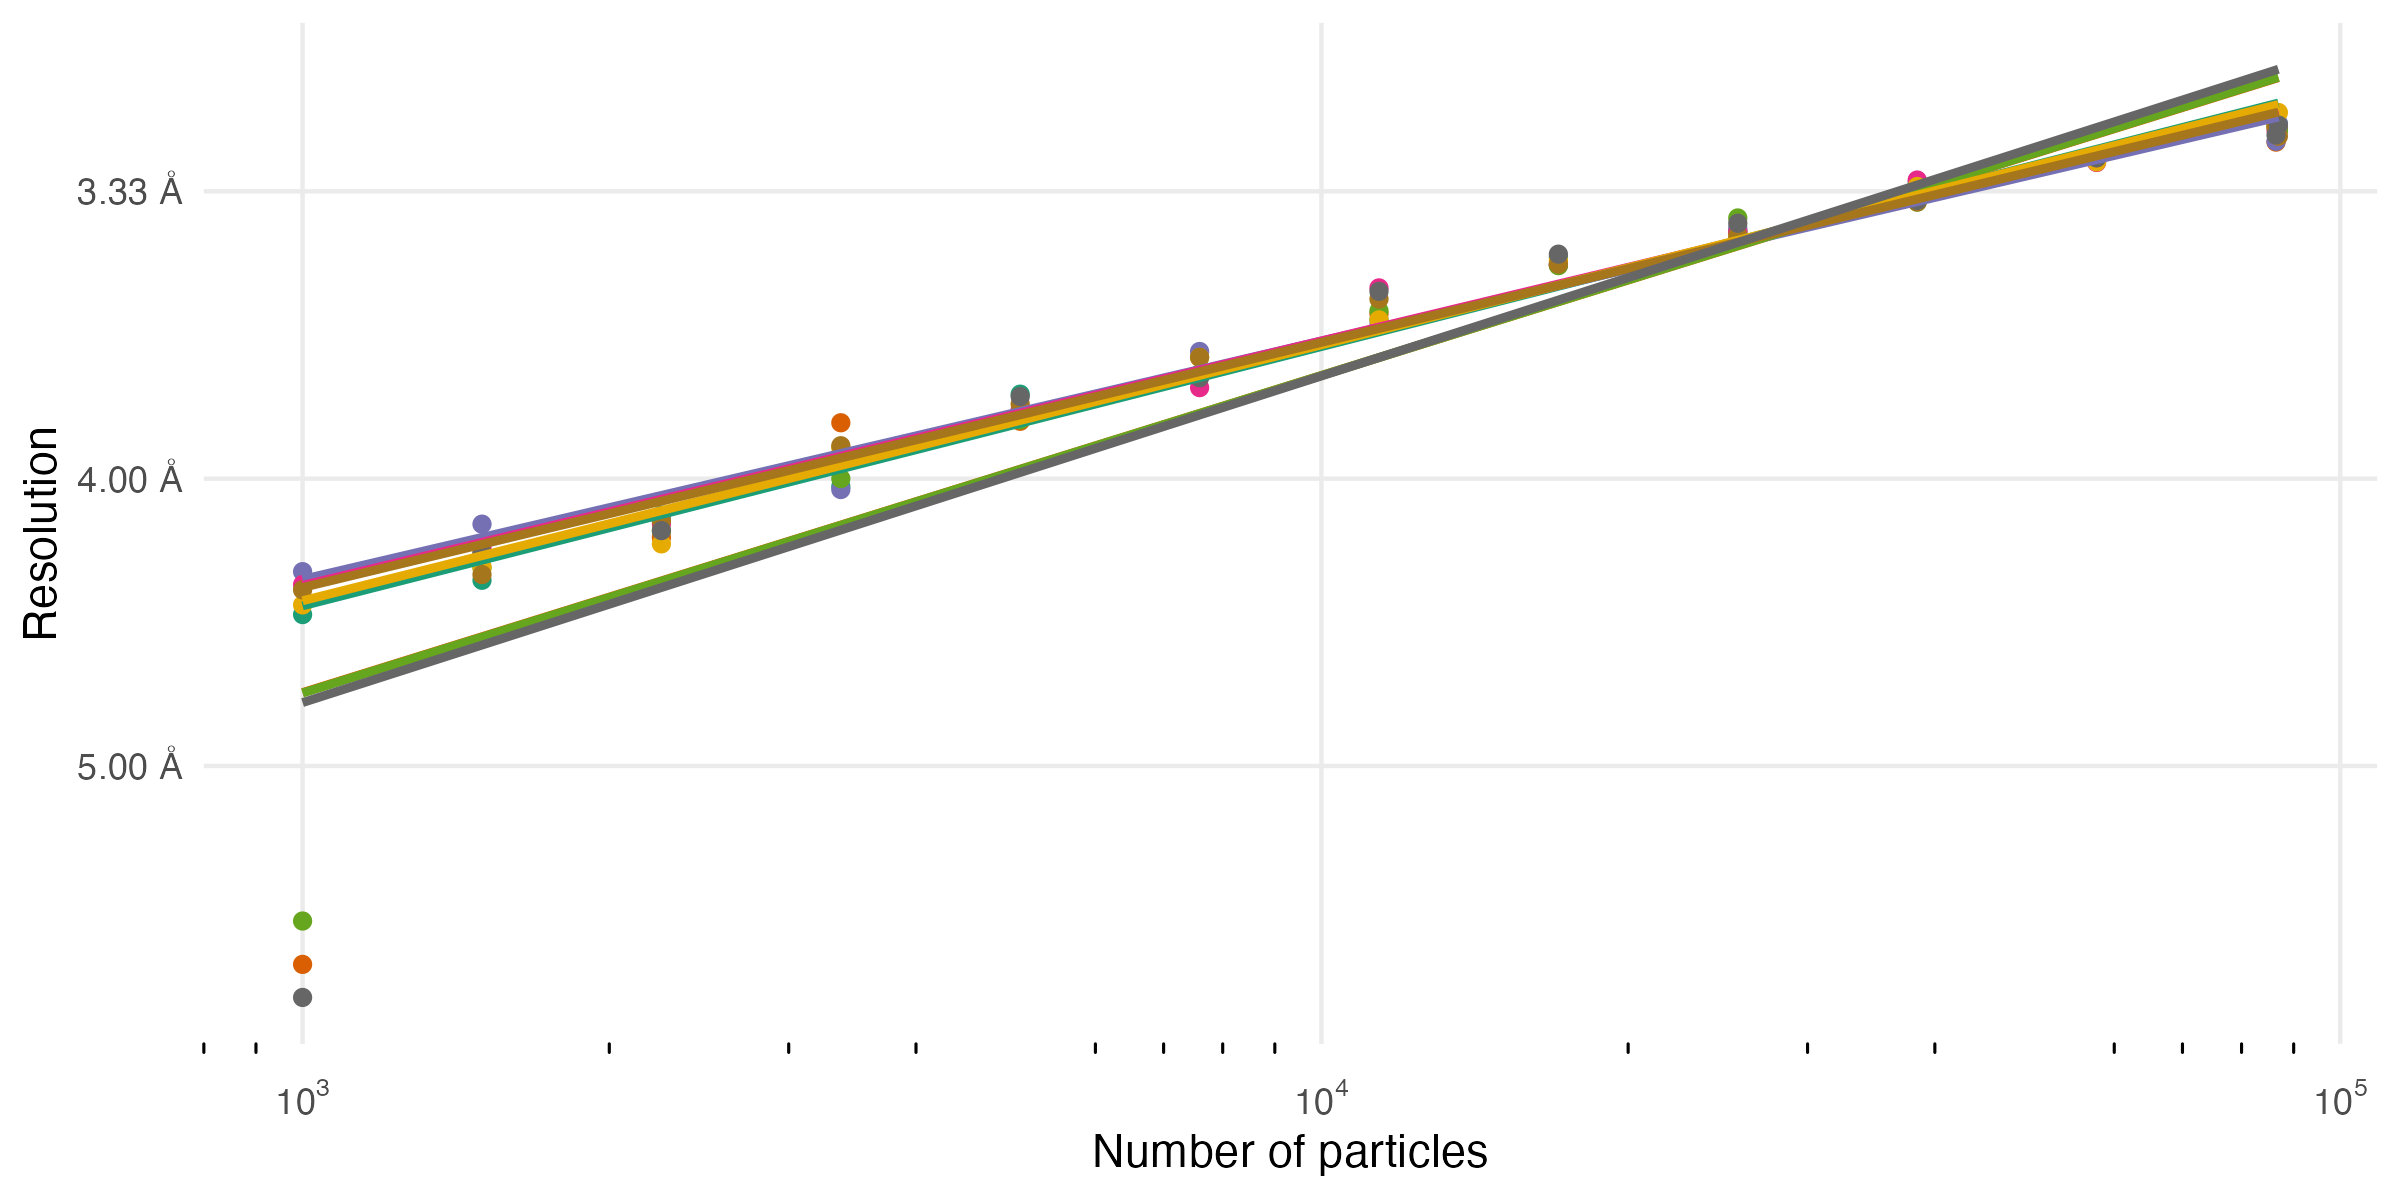
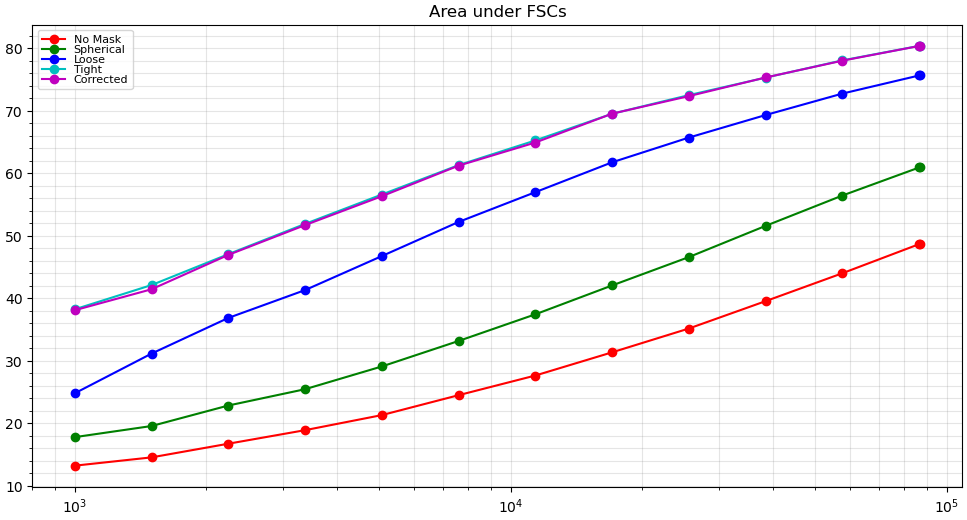
Re the funky FSCs above, I wonder whether it would be better to plot the area under the FSC in cases like this, as it will be less “noisy” and less sensitive to arbitrary resolution thresholds.
To make it more intuitive one could calculate an “equivalent resolution” value, which would be calculated as the 0.143 resolution of an “ideal” FSC that has the same area under the curve.
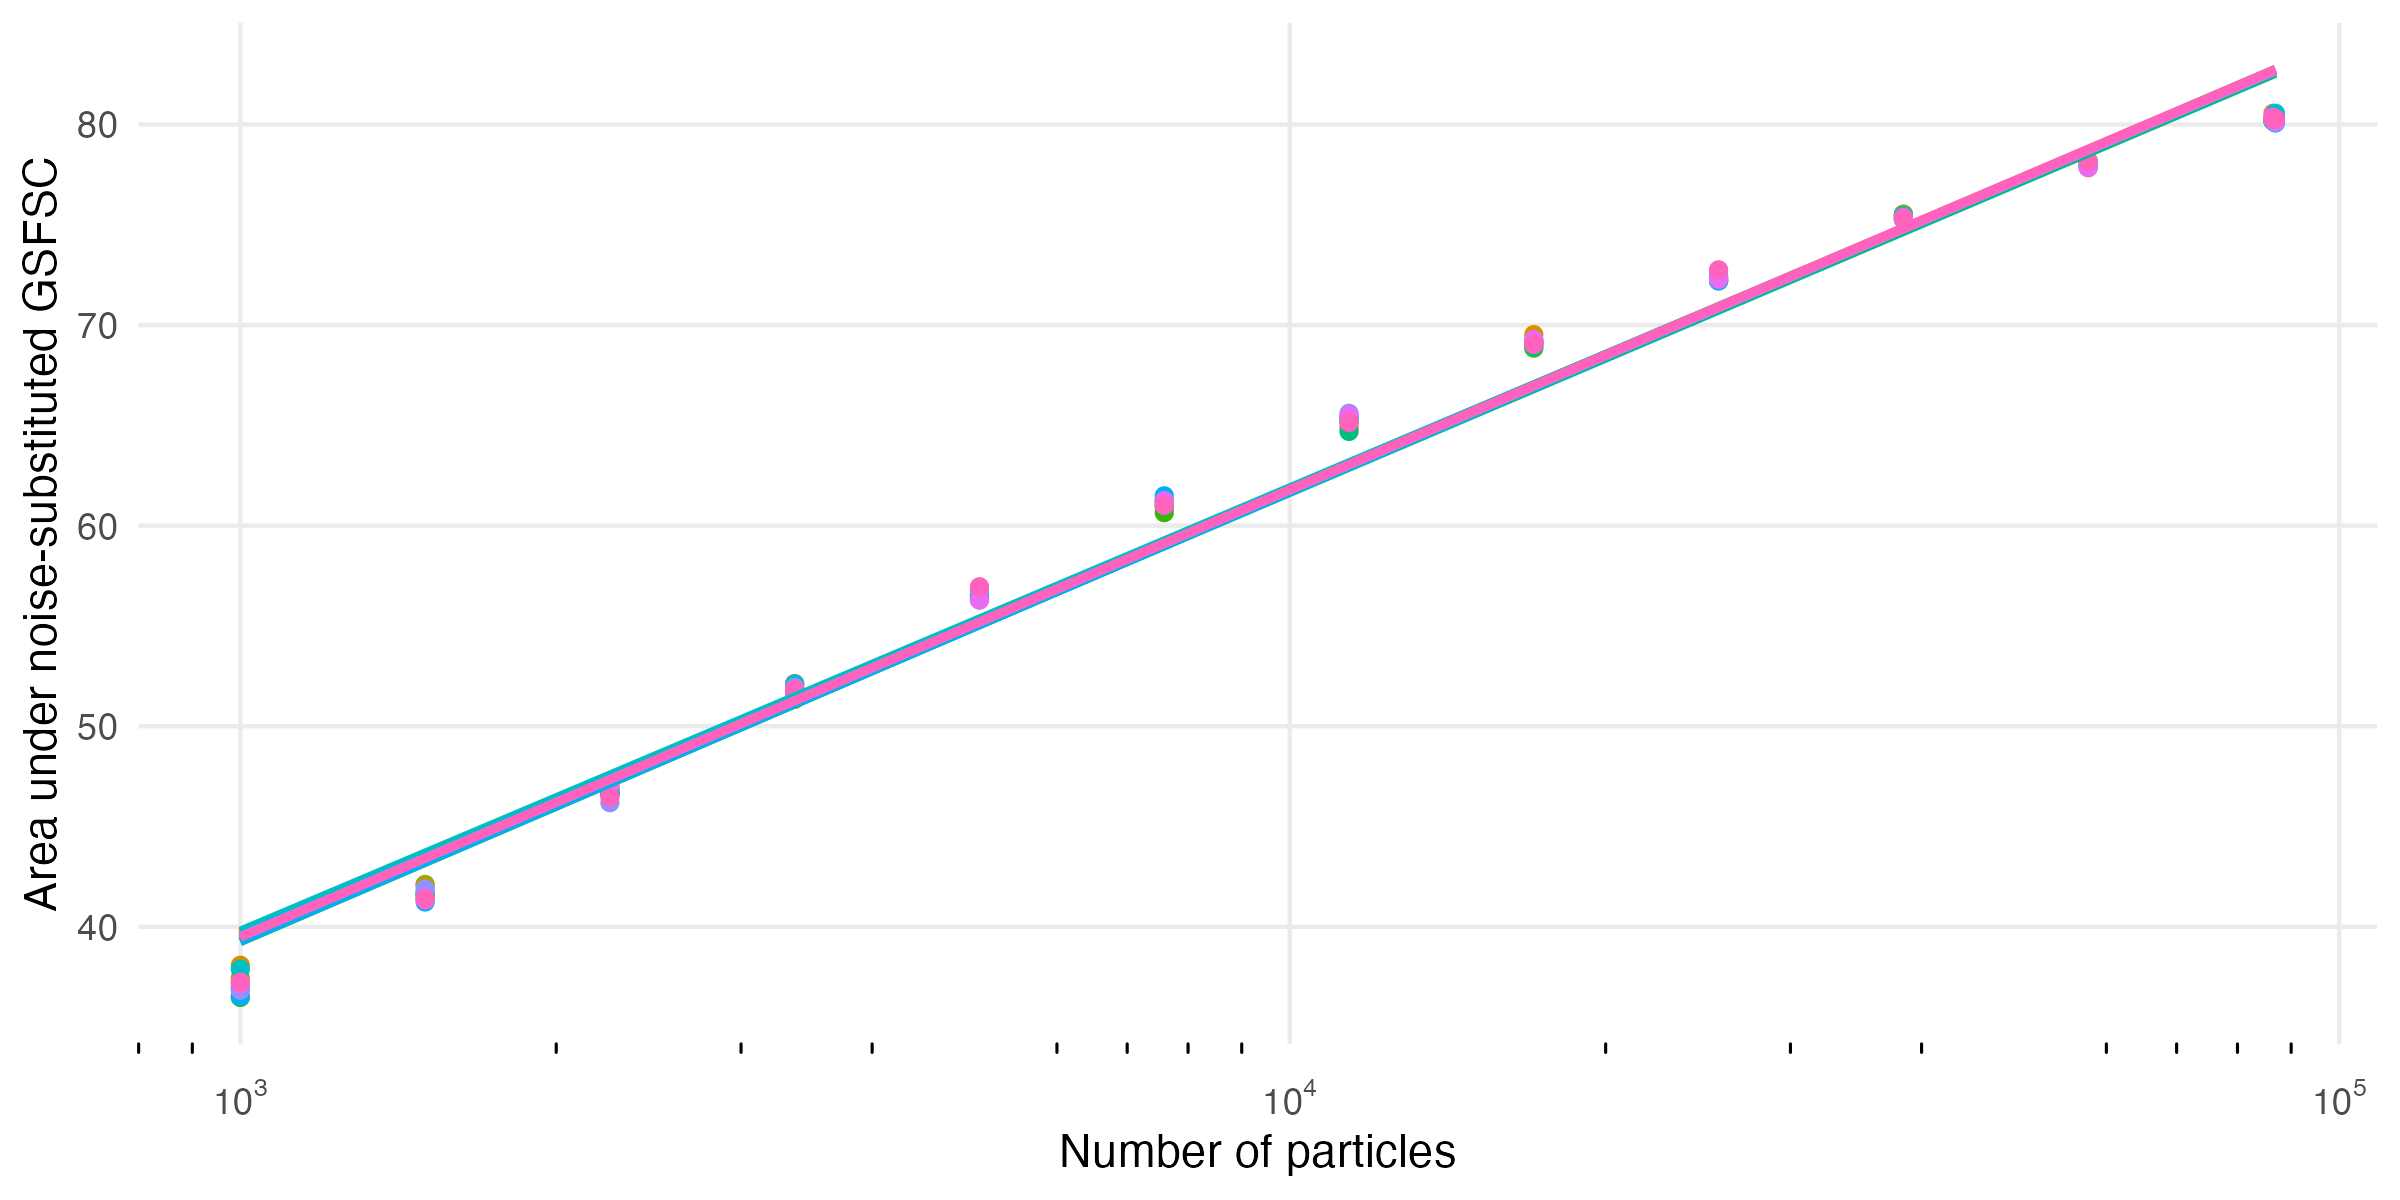
As you would expect, these are much less noisy in the low particle counts.
Your proposal of an “equivalent resolution” is an interesting one! I’m struggling to think of what an “ideal” FSC curve is though, and would be very interested in ideas you have on that front!
Thanks Rich I didn’t realize CS produced these plots!!
Ideal FSC curve - at a (very conservative) extreme could just be a rectangle, no? I.e. dropping from 1 to 0 vertically? Would probably need some kind of fudge factor constant to tweak that to correspond to resolution cutoffs of a real world sample (or synthetic data with a certain SNR).