Hello,
The reference motion correction job finished but I don’t see any trajectories in the final output. It seems that nothing has changed. I used all the default parameters.
Am I doing anything in an incorrect way? What did I miss?
Thanks,
Chen
Hello,
The reference motion correction job finished but I don’t see any trajectories in the final output. It seems that nothing has changed. I used all the default parameters.
Am I doing anything in an incorrect way? What did I miss?
Thanks,
Chen
Hi @csun,
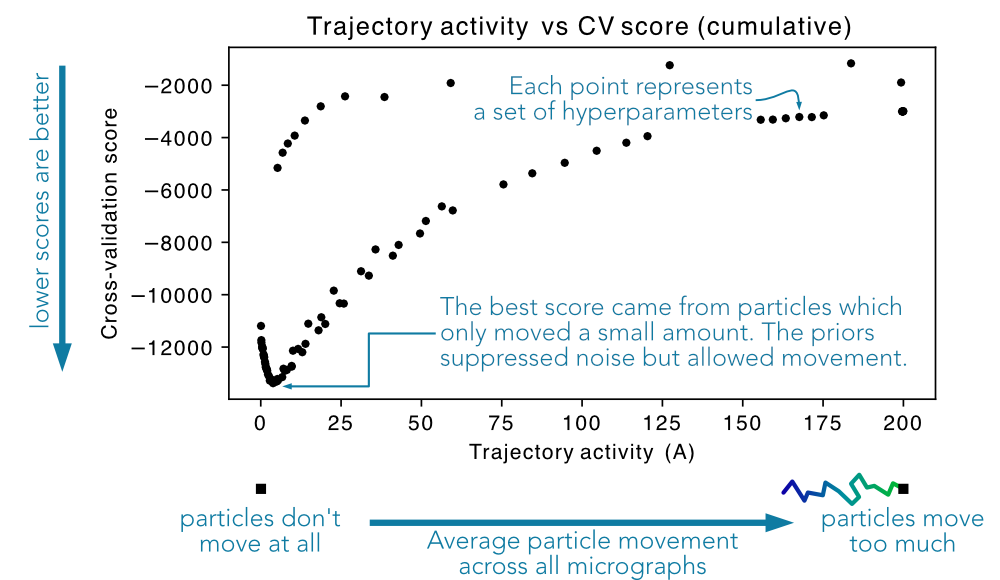
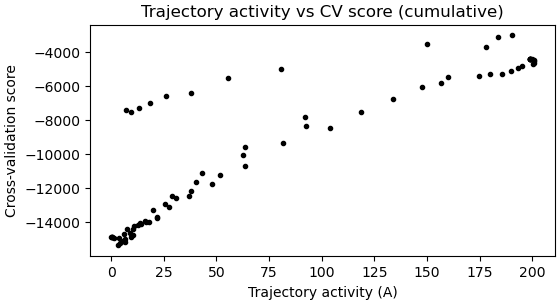
You probably aren’t doing anything wrong, this can sometimes happen. Since the per-particle residual motion after patch motion correction is usually small, the hyperparameter set that produces the best trajectory estimates tends to be one where the regularization is fairly “strong”. If you look at this figure from the cryosparc guide, you’ll notice the position of the cross-validation score optimum is very close to zero trajectory activity. In some datasets, either the optimization is too coarse, or the CV score doesn’t provide a clear enough distinction between the zero-trajectory regime and the small-but-accurate trajectory regime.
You could try using the “extensive” mode for the hyperparameter search, or you could eyeball the plots from the hyperparameter search and manually select a set of hyperparameters from earlier in the search where there was some activity, even if the measured CV score doesn’t say those trajectories are the best. I might be able to advise more if you share your “Trajectory activity vs CV score” plot from the last iteration of hyperparameter optimization.
– Harris
Hi Harris,
Thank you so much for your reply. I have deleted the previous reference motion correction job since it doesn’t seem to have changed anyting and rerun it with another local refinement job output.
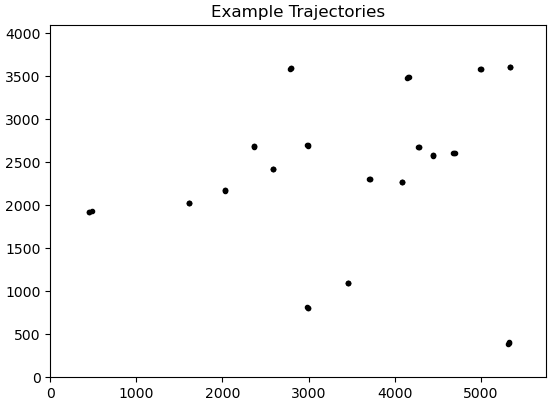
This time some particles have short linear trajectories but some are just random circles. Is it because they have low signal to noise ratio?
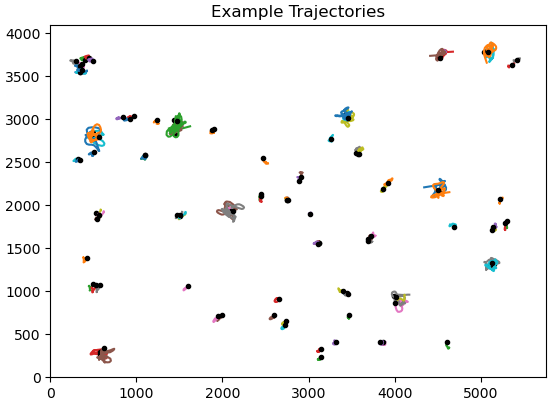
Below is the Trajectory activity vs CV score" Plot from the last iteraction of hyperparameter optimization. Is it a good curve? Which hyperparameter will be choosen?
Thanks,
Chen
Check that they are particles… what do the low pass filtered particles look like in the RBMC diagnostic output? If some are clearly particles while others don’t seem like anything at all, it might still be some noise/junk hiding in the data.
Hi Harris,
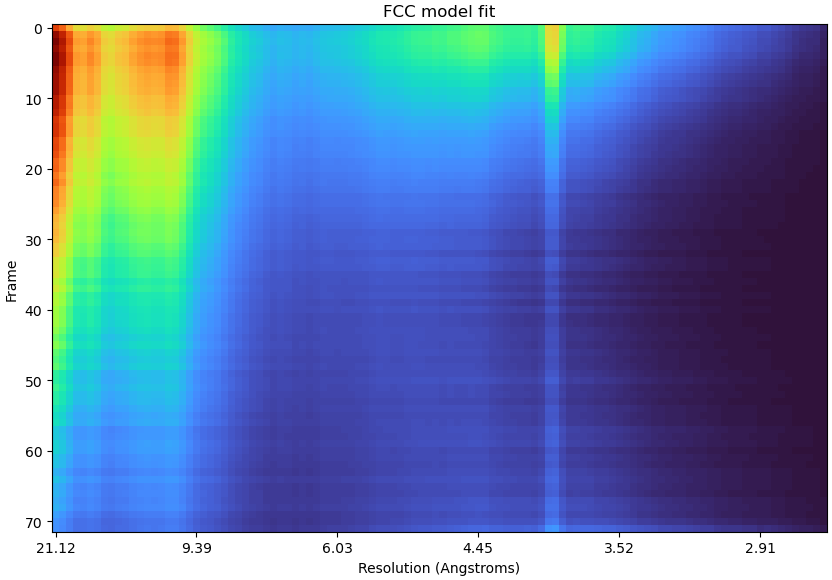
I think something is wrong. The local refinement job after reference motion correction output a map with layers of densities. What could be leading to this artifact? I also notice that there is an abnormal line in the FCC image. Do you know what could be causing it?
Thanks,
Chen
Thank you for your reply. I do see some are junk. How do I know which particles corresponding to the abnormal tracjectories?
Thanks,
Chen
That’s not very easy as CryoSPARC currently offers no easy way to get eyes on individual particles fully manually.
You could try another 2D classification run, with a large number of classes, iterations and uncertainty factor set. That’s usually pretty good at weeding out junk for me.
Hi @csun,
I agree with rbs_sci’s suggestion to screen for junk, that might explain several of the artifacts that you’re seeing. It’s best to get rid of as much junk as possible before trying to interpret the FCC plot anomalies.
To answer your specific questions:
This time some particles have short linear trajectories but some are just random circles. Is it because they have low signal to noise ratio?
It could be that, and that fits with the hypothesis that you have some empty or junk particles. It also could be a numerical problem - as you may know, before CryoSPARC v4.5, RBMC would sometimes fail and complain about a singular matrix. While the crash has been fixed, the underlying numerical problem can still arise, and typically when that happens you’ll see something like this where a few particles have rather under-regularized trajectories. I don’t know if this is what you’re experiencing, but in any event I recommend getting rid of as much junk as possible before proceeding.
Below is the Trajectory activity vs CV score" Plot from the last iteraction of hyperparameter optimization. Is it a good curve? Which hyperparameter will be choosen?
The hyperparameter set that gets chosen is always the one with the lowest cross validation score. In your case, the lowest black dot along the vertical axis seems to have a little bit of trajectory activity, but not much. That aligns with what you’re seeing in the output - small trajectories. As for whether it’s good or not, Ideally I’d like to see a situation where the zero-trajectory dots are noticeably above the lowest one like in the example plot that I posted. In your case, it looks like the difference in CV score isn’t so clear between the “optimal” hyperparam set, and the sets that result in zero trajectories, so I’d consider it marginal. Let me know if it still looks like this after the junk removal.
– Harris