Reference based motion correction job is terminating abnormally during cross validation

Ok, with all movies for a certain particle stack of around 12 K particles; I used 1 GPU, oversubscription 100 GB with 80 in-memory catche size. It failed within 5 mins during cross validation with the same error different Tif. I took that movie using curate exposures and it worked again.

I guess an issue is my complex has a lot of conformations so it ends up diluting the particles, so on a micrograph of 150 particles, only a few could belong to one class - so it probably ends up being at a 1000 micrographs to get enough particles for a high res reconstruction.
So for example ‘‘Working with 2399 movies containing 5673 particles’’ maybe its just too much for it handle?
The only other dataset that worked was the T20 test dataset but that has very few micrographs, perhaps thats suggestive of the problem?

I tried another dataset but the conditions are the same in terms of collection, with the same sort of error.

We were having a similar error/issue with EER images when processing on NVIDIA RTX6000 GPU /w 24 GB memory with resulting error “DIE: [refmotion worker 6 (Quadro RTX 6000)] ERROR: cuMemAlloc(size=17392893120): CUDA ERROR: (CUDA_ERROR_OUT_OF_MEMORY) out of memory” in the job.log.err.

After we raised the oversubscription to 100GB this appears to have helped the Reference based motion correction pass through the initial cross validation steps successfully.

The default of 20GB oversubscription (< 24GB) may have been trying to then put multiple micrographs in memory at the same time causing a failure and raising the value avoided this.

1 Like

As an update on this, Connor is currently diagnosing a possible hardware problem.

@larsonmattr it sounds like you’ve already found a workaround for your GPU memory exhaustion issue, but for what it’s worth I agree with your diagnosis and would have suggested exactly that workaround.

–Harris

1 Like

We found the source of error in our case - there was a clean-up session and one of the directory names was changed. Sorry for the earlier post!

1 Like

Hi,

To update I have had some success but still issues also.

I previously quoted I had 512 gb RAM but only 240 gb was available for jobs.
After working with single particle, we changed the ZFS settings and restarted the workstation, to ensure all CPU RAM could be used for cryosaprc. Now when I run Cryosparc and any job I have ~496 gb RAM for a job. I also had zpool degraded errors upon reboots but now those appear fixed.

I ran RBMC with 296 movies and 4.8K particles and it was successful. I even tested these particles in reconstruction and saw improvement of 0.2 A improvement from RBMC particles vs non.

However, after the job, 16gb /500gb of RAM and 150mb/30000mb of the swap was still being used. I’m not sure this is normal. It was previously 3.6 gb and 0 before running the cryosparc job.

After running the RMBC job again it crashed with the same error as above, but my htop doesn’t exactly show RAM being throttled during a job.

I then restarted the work station again to see if this would allow me to run the small job again, and it was successful?

So all I’m learning is that if I restart my workstation, the catch for RAM and swap clears and then I can run the job again. Does this make sense to anyone?

SO if anyone wants a long story short. If I reboot after each RBMC job I can successfully complete a small RMBC job, although not every time. If I don’t my catch (RAM and swap) keeps data and then also results in the random magic Tif error - reboot doesn’t allow me to always get success though, jobs with 10K particles still fail.

I tried using the trajectories to just extract particles and those jobs also fail with a magic Tif error.

This screen shot is post failed RBMC showing RAM with no other jobs running.

Cheers,
Connor

Has anyone managed to run the job with something like 10.7K particles over 6000 movies or 90K particles over 13K movies?

My conformational states get spread across many movies despite low amounts of particles, wondering if this many movies is some form of ‘stability’ issue for my RAM?

Thanks,
Connor

Hi Harris,

To update, I think i’ve found the potential issue. After running a successful job, my buff/cache doesn’t clear out the data, so I’m wondering if this stops me from running a second job?

I split my movies into stacks of ~400 movies and then I can successfully perform RMBC, but I think eventually they just fill my buff/cache.
Once I reset my computer it clears and I can run the job again.

Do you think this would explain the issue with random failure especially when using larger movie stacks?

Fist screen shot is after one run, the second screen shot is after the second run.

Cheers,
Connor

Hi @Connor, the 16GB of ram that is used after you run a job is probably still the ZFS ARC… I imagine that based on your feedback, Single Particle set your ARC size to 16 GB instead of 250 or whatever. That’s probably “normal”. As for the cache filling up - that’s also a normal part of Linux’s function. That memory should be freed on-demand to make room for other memory allocations. If you want to manually clear out the buffers/cache without restarting, you can run the following (as root): sync && echo 3 > /proc/sys/vm/drop_caches. You could try this and see if it helps at all.

You can check if the job failures are indeed the result of memory exhaustion by running dmesg | grep oom and seeing if it prints any lines (you’ll have to do this after the job dies but before a restart).

That said, I still think you may have a hardware problem - the abnormal termination is probably the same TIFF error, just with the more helpful error message getting lost, and that issue is very strange indeed - it’s not even consistently reproducible (on a given micrograph) on your own machine…

Have you done much processing on this machine with other jobs in cryosparc? If you’ve been running dozens of other jobs in v4.4 on this machine and they’ve all been completely fine, I might change my opinion that this is a memory/hardware problem.

Hi,

I can tell you I have processed 1000s of Cryosparc jobs on this computer and using multiple versions of cs.

I’ve almost run every single type job type successfully. There is only one job I’ve never managed as it always fails and thats 3D Flex reconstruct.
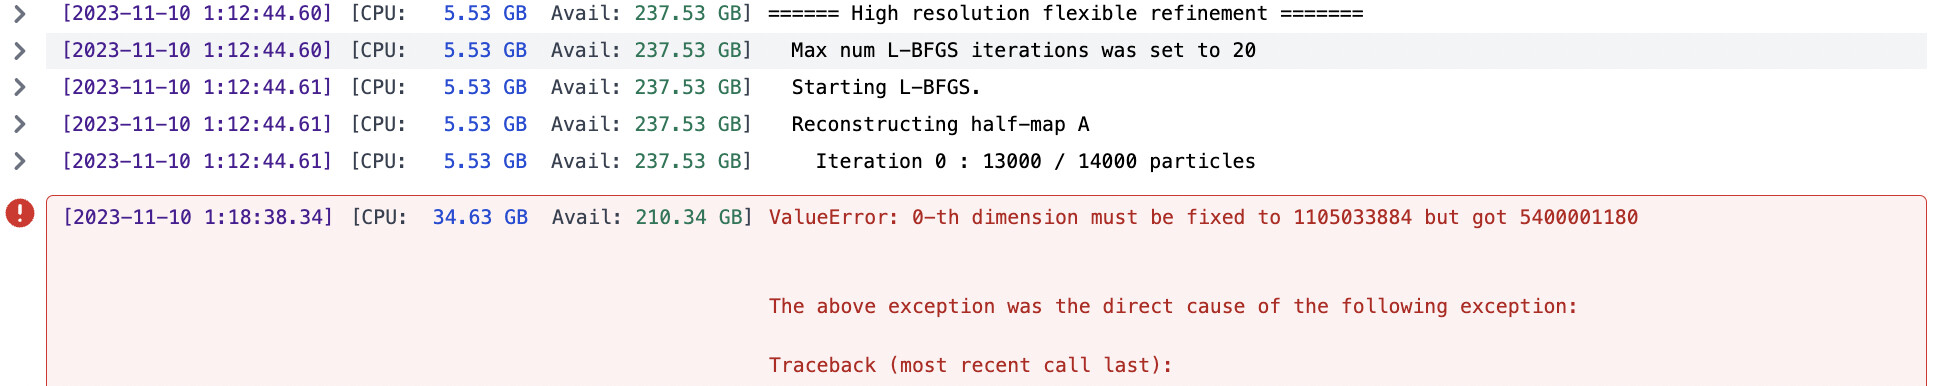
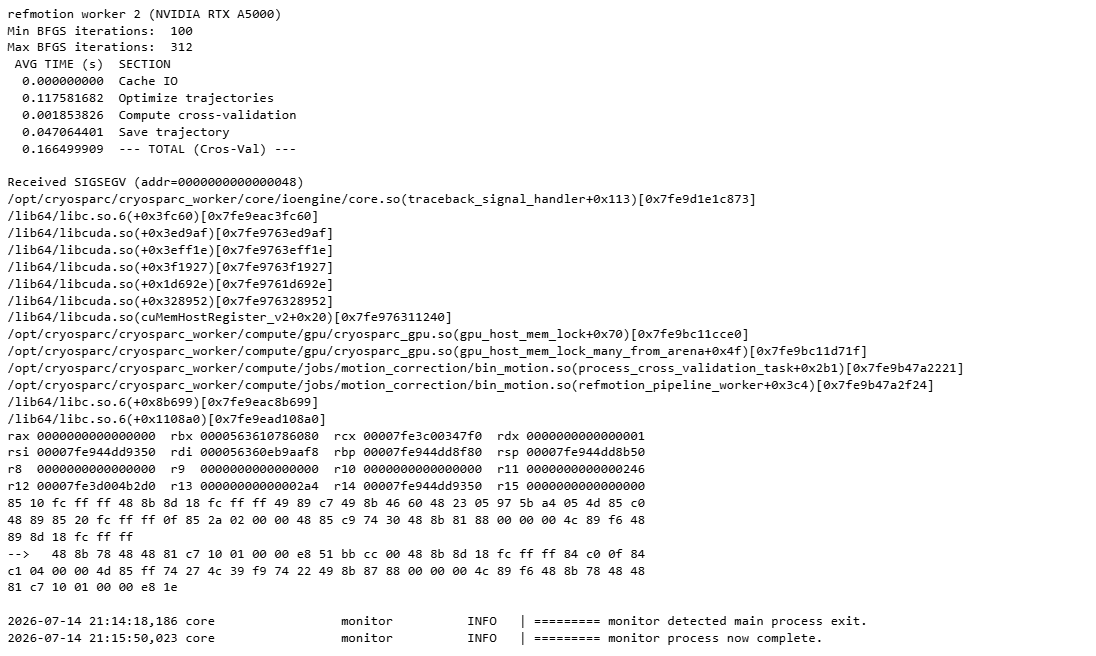
It will fail at this position and never succeeds at processing the first particle stack (i’ve tested multiple particle stacks):

RBMC is the only other job I’ve had issues with, and this one is odd because it works sometimes.

My work around has been for a single conformation:

  1. Take movies with most particles per movie (I ended up with 290 movies with 4.8K particles
  2. run RBMC with these movies (estimate trajectories and dose weights)
  3. test in refinement if improved and it was successful
  4. split my movies into stack of ~470 movies per stack.
  5. run RBMC with previously calculated trajectories/dose weights with each stack and pool all particles together for refinement.

My compute setting for each stack typically start with 4 GPUs, 100 gb over, 0.8 cache (i’ve messed with 0.2, 0.4, 0.6, not really noticing a difference in speed or failure). Each one takes around 30 mins.

When they fail I attempt with 1 GPU same settings and sometimes it fixes it. However sometimes I need to reset the computer and then try again. These one’s typically take 90 mins with 1 GPU.

I still have 8 more movie stacks to go through.
I have tested some of the particles I have RBMC’d so far (~53K) and the resolution is at 2.9A, which is equal to the full particle stack (~90K) at 2.9A.

I hope this helps, I’ve used multiple versions of cryosparc.

Our goal is going to be to set a cron job to clear out the cache on some kind of regular basis.

Edit: with 4.4v specifically I’ve rerun patch motion, patch CTF, blob picking, extraction, ab intio, hetero, homo and NU refinements, symmetry expansion, alignments tools, 3D variability, cluster, local refinements etc.

Connor

Hi Harris,

Maybe this is helpful information.

My full work around has been to split movies up into stacks and then queue each individually, this way I just pool all the particles for later refinement. Sometimes stacks of 100 movies has been even better, I could use 4 GPU, 100 over sup, 0.2 cache, and process each stack with 4-8 mins. By doing this I was able to process 90K particles over 19K movies for one conformation of my structure.

This makes me think there’s some stability issue with RBMC over long periods of time with big data, I also find it weird cache is not cleared post running the job, which seems typical with cryosparc jobs after speaking to others.

After testing, this has now gone smoothly for me. Resolutions have improved from 2.9 A to 2.8A using RBMC. This beats Bayesian polishing for my dataset.

So I’m still unclear why I cant run all data at once using 1 GPU etc.

Cheers,
Connor.

Hi @Connor, thanks for providing more information. I’m still unclear why you’re having trouble as well, but your responses have decreased my conviction that you have a hardware problem. The thing is, both I and many others have processed large datasets that take many hours without seeing these difficulties, so if it is a bug that’s responsible, there must be some detail about your data that is causing this issue to occur where it usually wouldn’t. As you continue processing more datasets, please occasionally try a full run with multiple GPUs and see if you encounter a dataset where it runs smoothly. At the moment it’s difficult to proceed debugging this issue but if we can narrow down the dataset properties that cause it, perhaps we can figure it out.

Dear Harris @hsnyder and all,

On I have similar error while running the Reference based motion correction job on one of workstations.

I tired to use just 1 GPU but the error is always the same.

Any tips?

Thank you.

Kind regards,
Dmitry

@hsnyder the results of the commands

sudo journalctl | grep -i OOM
sudo dmesg | grep -i OOM

dmitry@cryoem1:~$ sudo journalctl | grep -i OOM
[sudo] password for dmitry:
dic 26 11:30:29 cryoem1 systemd[1]: Stopping Userspace Out-Of-Memory (OOM) Killer…
dic 26 11:30:29 cryoem1 systemd[1]: systemd-oomd.service: Deactivated successfully.
dic 26 11:30:29 cryoem1 systemd[1]: Stopped Userspace Out-Of-Memory (OOM) Killer.
dic 26 11:30:29 cryoem1 systemd[1]: systemd-oomd.service: Consumed 12min 17.977s CPU time.
dic 26 11:34:13 cryoem1 systemd[1]: Starting Userspace Out-Of-Memory (OOM) Killer…
dic 26 11:34:13 cryoem1 systemd[1]: Started Userspace Out-Of-Memory (OOM) Killer.
ene 01 19:09:52 cryoem1 systemd[1]: Stopping Userspace Out-Of-Memory (OOM) Killer…
ene 01 19:09:52 cryoem1 systemd[1]: systemd-oomd.service: Deactivated successfully.
ene 01 19:09:52 cryoem1 systemd[1]: Stopped Userspace Out-Of-Memory (OOM) Killer.
ene 01 19:09:52 cryoem1 systemd[1]: systemd-oomd.service: Consumed 14min 28.232s CPU time.
ene 01 19:12:31 cryoem1 systemd[1]: Starting Userspace Out-Of-Memory (OOM) Killer…
ene 01 19:12:31 cryoem1 systemd[1]: Started Userspace Out-Of-Memory (OOM) Killer.
ene 06 20:08:30 cryoem1 systemd[1]: Stopping Userspace Out-Of-Memory (OOM) Killer…
ene 06 20:08:30 cryoem1 systemd[1]: systemd-oomd.service: Deactivated successfully.
ene 06 20:08:30 cryoem1 systemd[1]: Stopped Userspace Out-Of-Memory (OOM) Killer.
ene 06 20:08:30 cryoem1 systemd[1]: systemd-oomd.service: Consumed 10min 6.261s CPU time.
ene 06 20:10:34 cryoem1 systemd[1]: Starting Userspace Out-Of-Memory (OOM) Killer…
ene 06 20:10:34 cryoem1 systemd[1]: Started Userspace Out-Of-Memory (OOM) Killer.
ene 09 14:35:35 cryoem1 systemd[1]: Stopping Userspace Out-Of-Memory (OOM) Killer…
ene 09 14:35:35 cryoem1 systemd[1]: systemd-oomd.service: Deactivated successfully.
ene 09 14:35:35 cryoem1 systemd[1]: Stopped Userspace Out-Of-Memory (OOM) Killer.
ene 09 14:35:35 cryoem1 systemd[1]: systemd-oomd.service: Consumed 4min 19.444s CPU time.
ene 09 14:37:28 cryoem1 systemd[1]: Starting Userspace Out-Of-Memory (OOM) Killer…
ene 09 14:37:28 cryoem1 systemd[1]: Started Userspace Out-Of-Memory (OOM) Killer.
ene 11 06:37:06 cryoem1 systemd-oomd[1811]: Failed to connect to /run/systemd/io.system.ManagedOOM: Connection refused
ene 11 06:37:06 cryoem1 systemd-oomd[1811]: Failed to acquire varlink connection: Connection refused
ene 11 06:37:06 cryoem1 systemd-oomd[1811]: Event loop failed: Connection refused
ene 11 06:37:06 cryoem1 systemd[1]: systemd-oomd.service: Main process exited, code=exited, status=1/FAILURE
ene 11 06:37:06 cryoem1 systemd[1]: systemd-oomd.service: Failed with result ‘exit-code’.
ene 11 06:37:06 cryoem1 systemd[1]: systemd-oomd.service: Consumed 4min 21.788s CPU time.
ene 11 06:37:06 cryoem1 systemd[1]: systemd-oomd.service: Scheduled restart job, restart counter is at 1.
ene 11 06:37:06 cryoem1 systemd[1]: Stopped Userspace Out-Of-Memory (OOM) Killer.
ene 11 06:37:06 cryoem1 systemd[1]: systemd-oomd.service: Consumed 4min 21.788s CPU time.
ene 11 06:37:06 cryoem1 systemd[1]: Starting Userspace Out-Of-Memory (OOM) Killer…
ene 11 06:37:07 cryoem1 systemd-oomd[157089]: Failed to connect to /run/systemd/io.system.ManagedOOM: Connection refused
ene 11 06:37:07 cryoem1 systemd-oomd[157089]: Failed to acquire varlink connection: Connection refused
ene 11 06:37:07 cryoem1 systemd-oomd[157089]: Event loop failed: Connection refused
ene 11 06:37:07 cryoem1 systemd[1]: Started Userspace Out-Of-Memory (OOM) Killer.
ene 11 06:37:07 cryoem1 systemd[1]: systemd-oomd.service: Main process exited, code=exited, status=1/FAILURE
ene 11 06:37:07 cryoem1 systemd[1]: systemd-oomd.service: Failed with result ‘exit-code’.
ene 11 06:37:07 cryoem1 systemd[1]: systemd-oomd.service: Scheduled restart job, restart counter is at 2.
ene 11 06:37:07 cryoem1 systemd[1]: Stopped Userspace Out-Of-Memory (OOM) Killer.
ene 11 06:37:07 cryoem1 systemd[1]: Starting Userspace Out-Of-Memory (OOM) Killer…
ene 11 06:37:07 cryoem1 systemd[1]: Started Userspace Out-Of-Memory (OOM) Killer.
ene 14 02:06:24 cryoem1 systemd-oomd[157122]: Killed /user.slice/user-1000.slice/user@1000.service/app.slice/app-org.gnome.Terminal.slice/vte-spawn-f798f239-c358-4a78-ad90-e1ee81385303.scope due to memory pressure for /user.slice/user-1000.slice/user@1000.service being 80.62% > 50.00% for > 20s with reclaim activity
ene 14 02:06:24 cryoem1 systemd[3814]: vte-spawn-f798f239-c358-4a78-ad90-e1ee81385303.scope: systemd-oomd killed 68 process(es) in this unit.

sudo dmesg | grep -i OOM
did not show anything.

Any ideas? shall I do some modification with memory?

thank you

Kind regards,
Dmitry