Hi all,
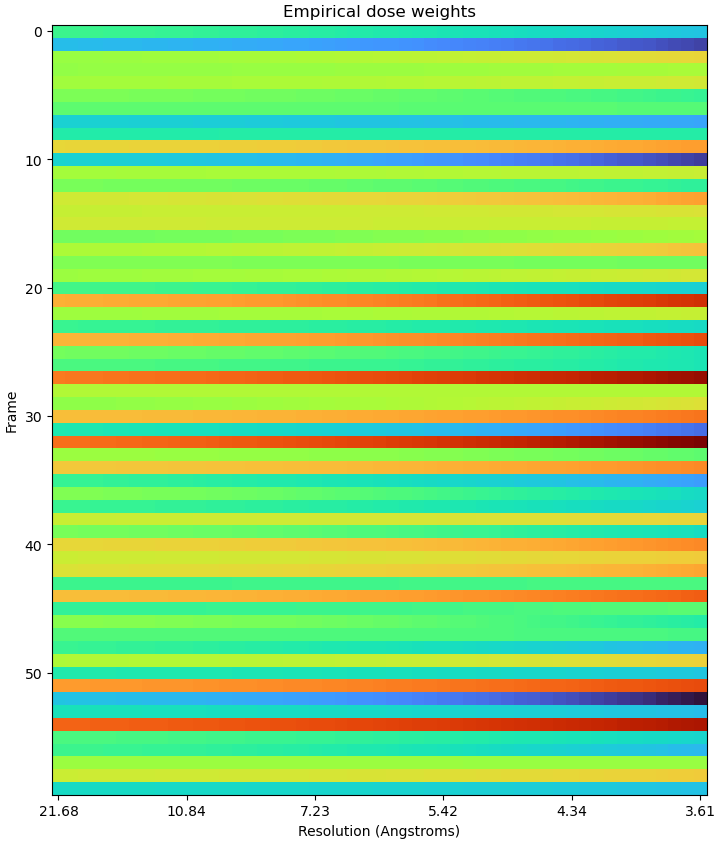
The new RBMC seens to be really helpful (thanks all cryosparc devs) and I wanded to try it out with my data. I ran patch motion and all the subsequent processing and got a ~3.5A reconstruction from NU refinement. However whe I was trying to run RBMC, the FCC and emprical dose weight plots does not make sense (see attached). I played with hyparamater search thoroughness, target number of particles and number of GPUs (in case it’s an computational error) but none of these seems to have helped. Could anyone have an idea what might be going on here? I appreciate all the help!
Hi @yang.suo,
Indeed, I think that’s the strangest EDW plot I’ve seen. I don’t know off the top of my head what the cause is, but could you provide the following information?
- Total number of particles
- Number of micrographs
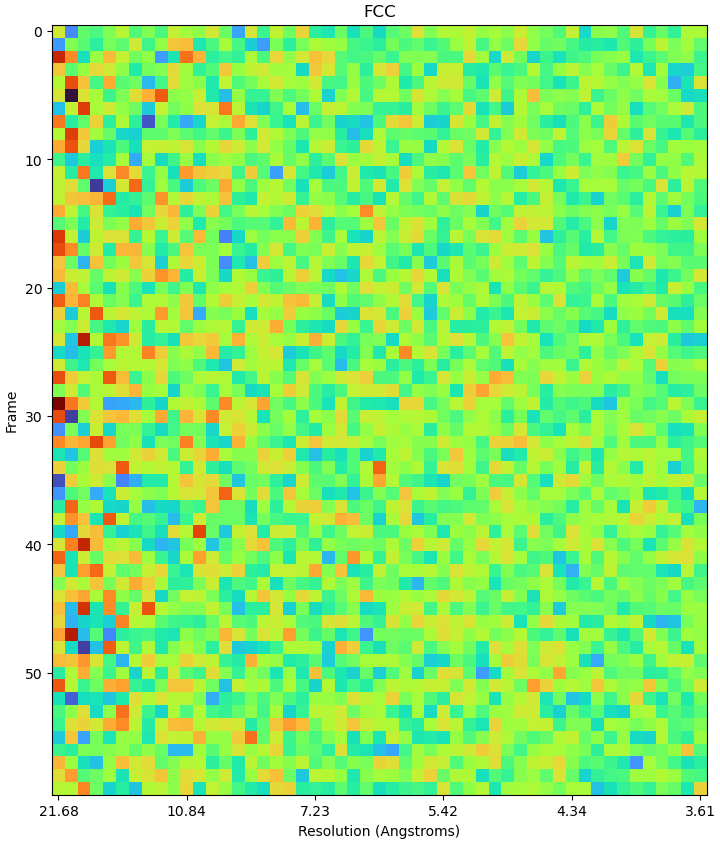
- Raw FCC plot (first plot from the empirical dose weight step)
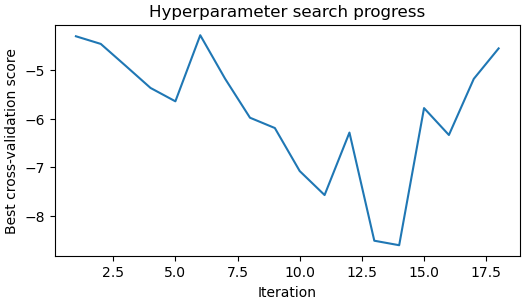
- The last “Hyperparameter search progress” plot
- The last “Trajectory activity vs CV score” plot
– Harris
Hi Harris,
Thanks! That’s strange indeed and didnt make much sense. Here is the info:
-
Total number of particles: 391,969
-
Number of micrographs: 19,122
-
Raw FCC plot (first plot from the empirical dose weight step)
-
The last “Hyperparameter search progress” plot
-
The last “Trajectory activity vs CV score” plot
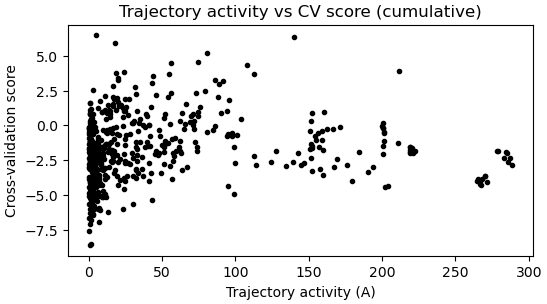
I did notice that the “hyperparameter search progress” and “Trajectory activity vs CV score” plot looked quite different from those in tutorial, without a clear trend or a minimum, but not sure what caused this.
By the way, the data is from a Krios microscope with K3 camera, acquisiton was in non-super resolution mode.
Thanks!
Hi @yang.suo,
Wow, all of those plots look strange. How does your upstream structure look, is it high quality? Is it possible that your particle set contains a lot of junk picks still? Is there anything otherwise abnormal about your data?
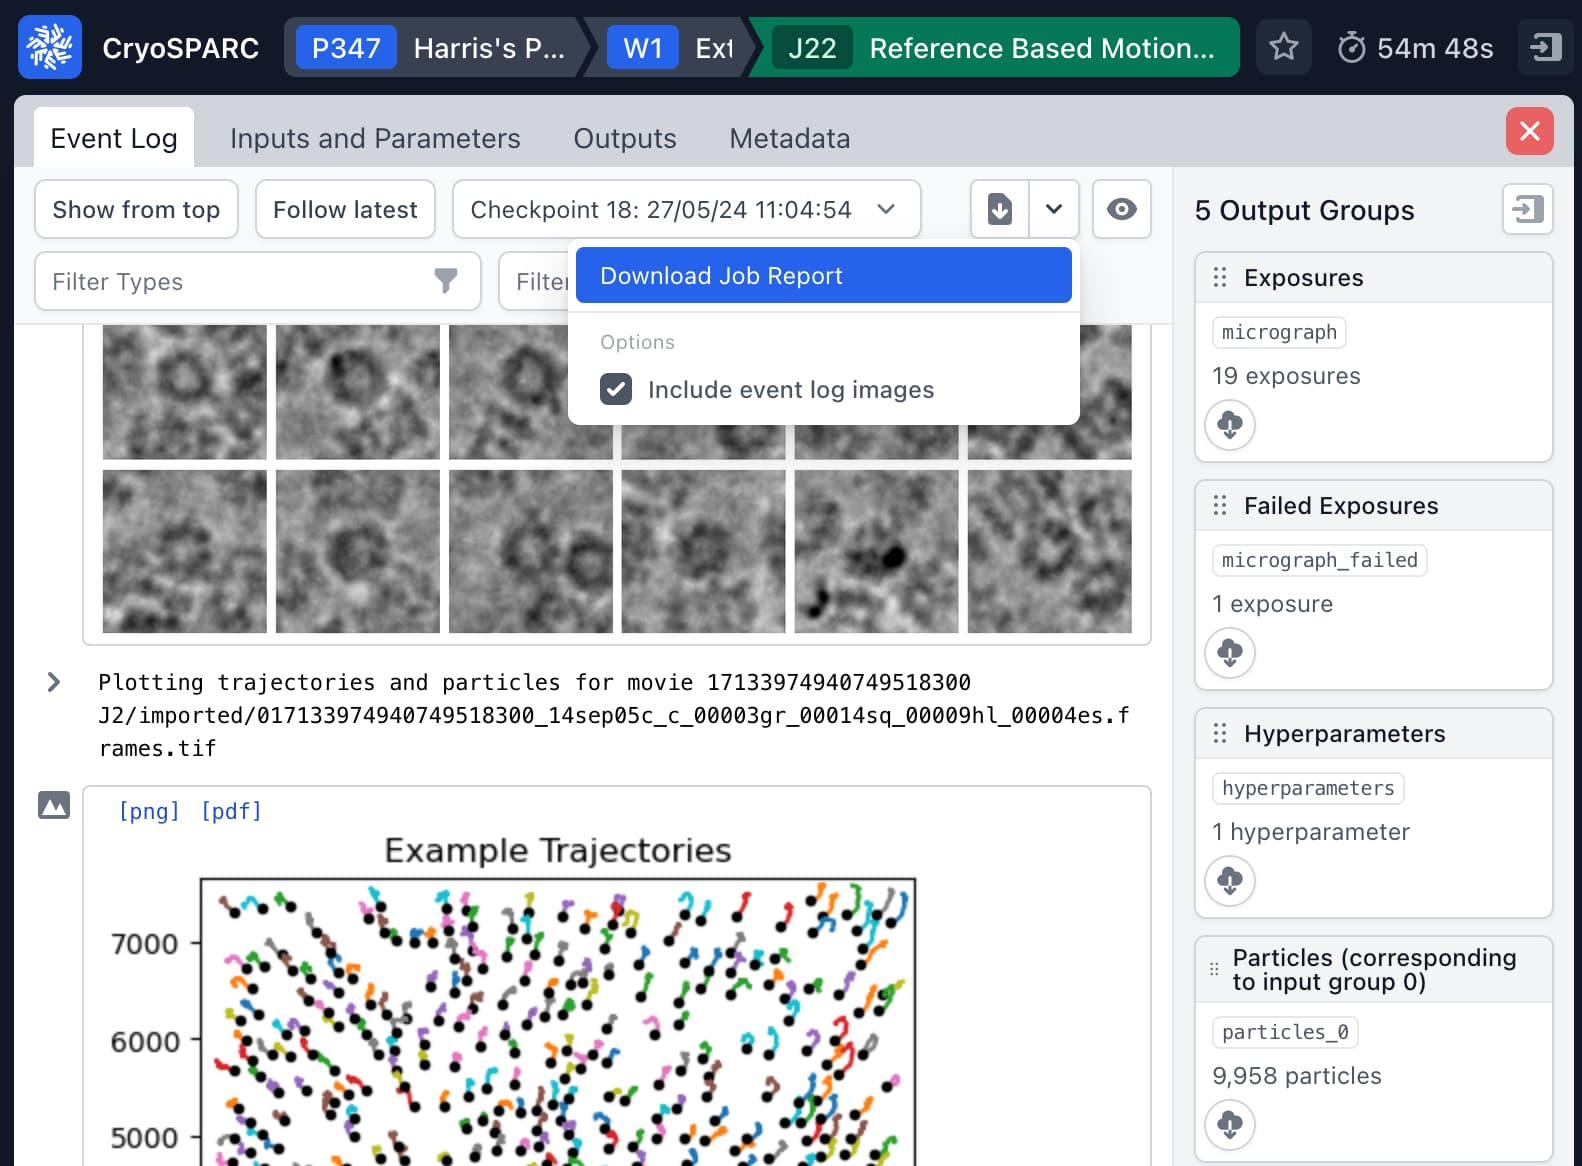
It might be easiest for me to advise after seeing the job report, which can be downloaded by using the link shown in the screenshot below (open the drop down menu beside the file download icon). Please make sure the “include event log images” box is checked. I’ll send you a private message shortly regarding how to send the job report to us.
– Harris
Hi @yang.suo,
I’ve looked through the logs you sent and all of the plots are significantly different from what I’d expect to see. Is it at all possible that your dataset contains a lot of junk particles? I know that you were able to get a structure of reasonable resolution upstream of RBMC, but nevertheless, I’d recommend having a look at the example particle plots from the last stage of RBMC and from your particle extraction job to see if a lot of the particles are empty or contain junk.
Assuming you did some 2D classification upstream of your ab-initio/refinement, what did the classes look like? If you can share some plots of the extracted particles and any classification results, that might help us figure out if the input data is the problem here.
Thanks,
Harris
Edit/PS: could you post a few plots from the upstream patch motion correction as well?