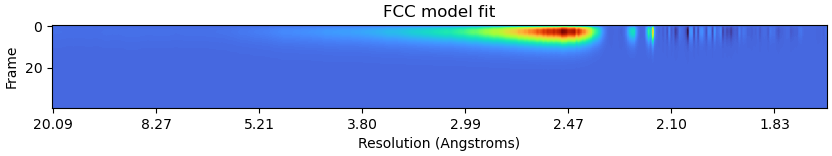
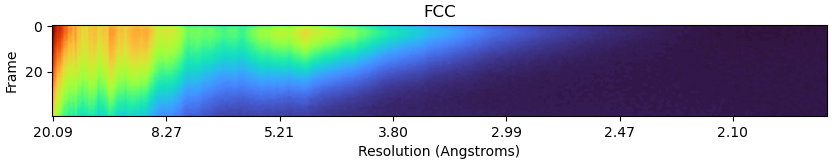
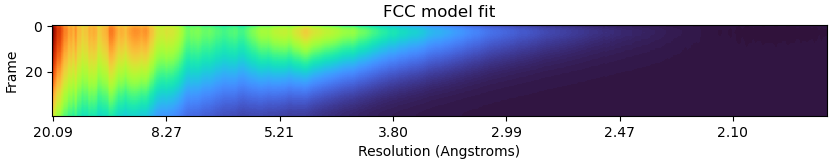
I am wondering if the strange FCC model fit could be caused by too tight a mask?
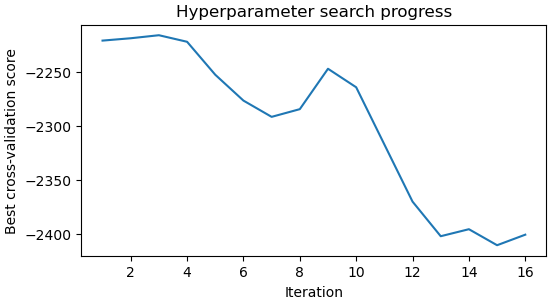
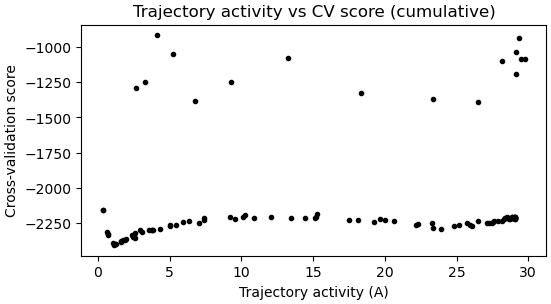
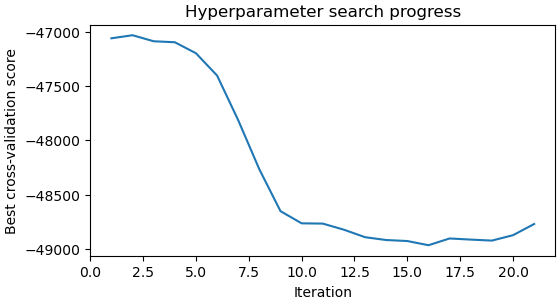
Looking back at the hyperparameter search, I’m not overly confident in the parameters, given the appearance of the plots for ‘Trajectory activity vs CV score’ and ‘Hyperparameter search progress’ after iteration 16. The CV score didn’t decrease by much over the iterations, and the CV score over trajectory activities is relatively flat:
Are bad hyperparameters going to contribute to the strange FCC model fit?
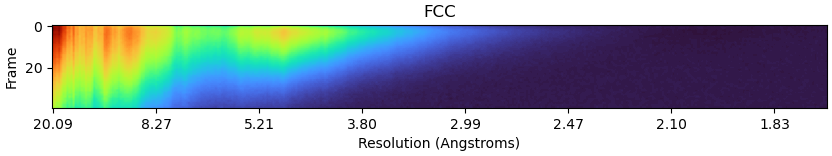
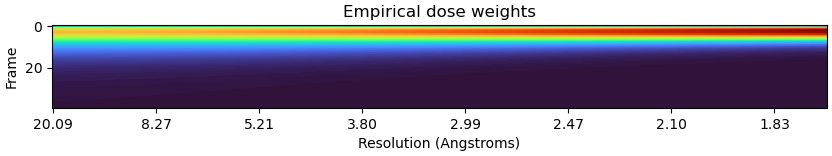
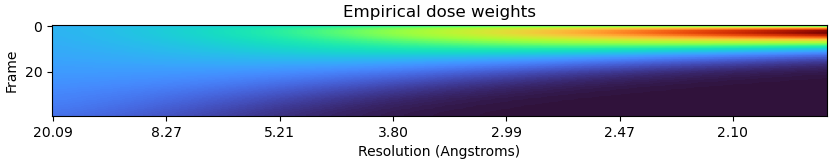
Presumably it wouldn’t be sensible to continue with motion correction given the plots above, even if the FCC and empirical dose weights don’t look unreasonable.
Some background: this is a virus particle reconstruction (1080pix box sizes with an average of 14 particles per micrograph, masking on capsid wall); after homogeneous refinement; no duplicates present; most junk should have been removed through classification. The solvent mask is tight but appears to be fine for generating a sensible looking GSFSC plot to high resolution.
Things I am thinking to try:
Looser / less featured solvent mask (if this could be a potential cause of observed FCC model fit?)
Curating micrographs to select those with highest number of particles (if bad hyperparameters could be causing this?)
Further classification to remove any residual junk.
Increasing the Target number of particles for Hyperparameter and/or Empirical dose weighting (if possible, as the box size has been causing some issues).
Couple of things to try - remove the mask completely, and try using Extensive parameterisation (if it’ll work). As you hypothesise, you can also try increasing the particles, but the hyperparameter estimation definitely looks unhealthy.
What resolution are you working from? RBMC does really well at higher resolutions, but can struggle with lower ones.
Thanks. Will try without a mask — wasn’t sure whether masking the genome inside would help or hinder here. Resolution is 1.71 currently and the map looks sensible.
Hyperparameters:
Exiting early, all search paths have reached the ~zero trajectory regime.
Best hyperparameters:
Spatial prior strength: 7.0413e-04
Spatial correlation distance: 500
Acceleration prior strength: 2.8008e-03
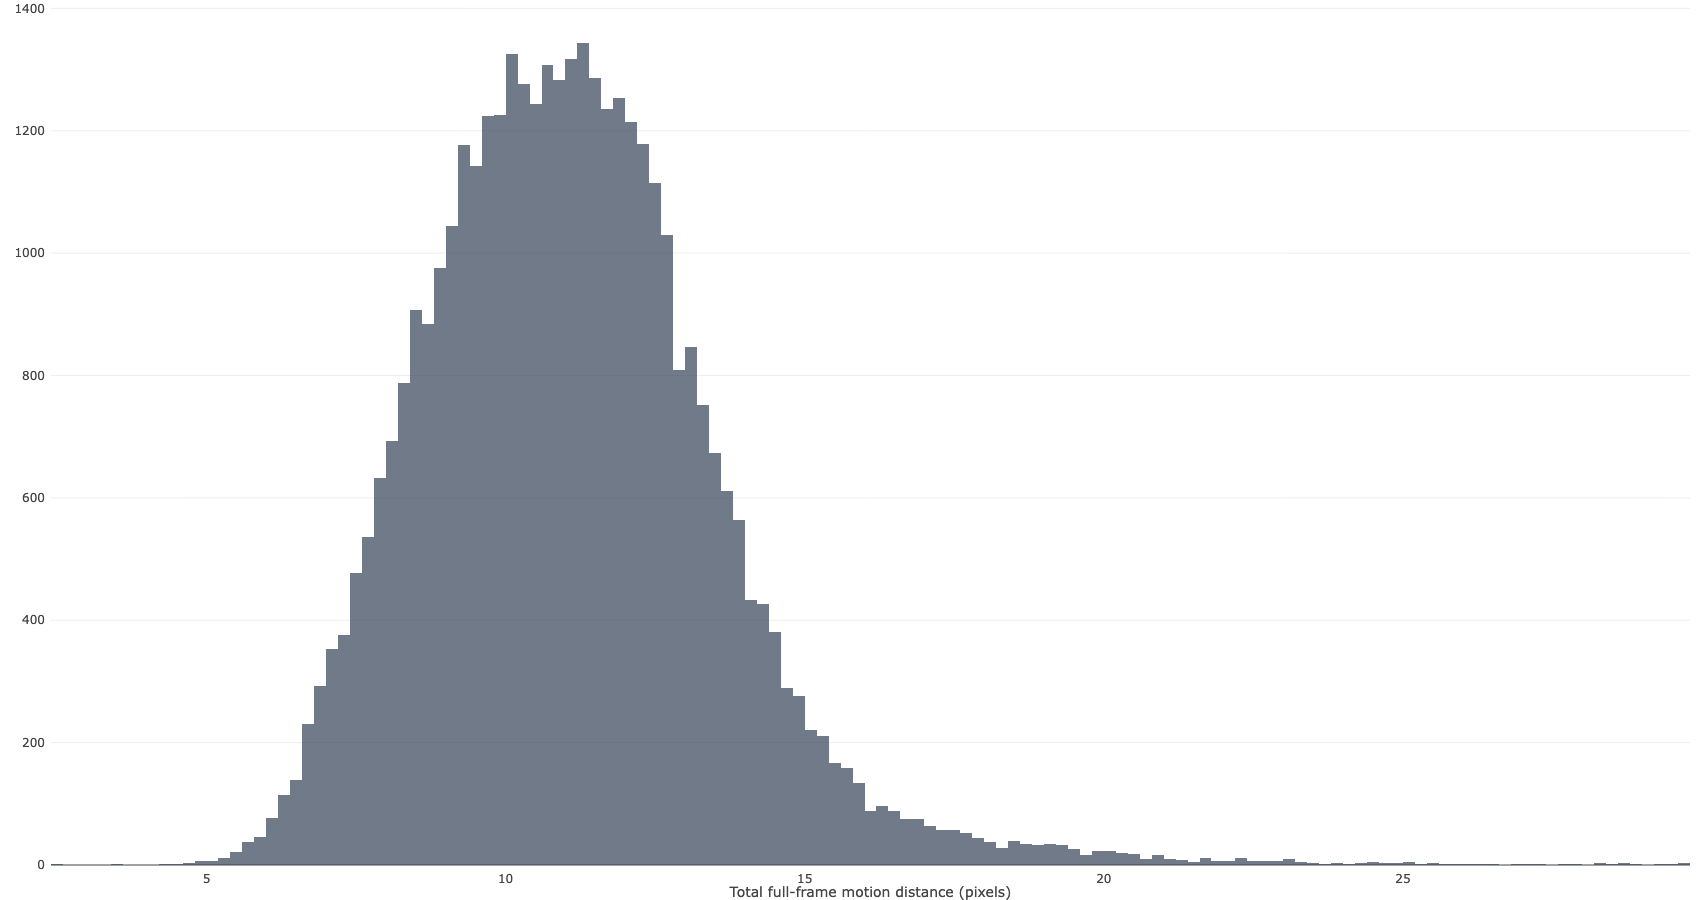
Right. The correlation distance won’t be estimated with “fast” mode, so that being 500 isn’t unusual. But the early quit means it’s struggling to find a good parameter set. If you go back to check exposure curation, is there a distinct separation between low and high motion micrographs?
But I’d try without a mask, and extensive validation which I find much more robust. It’s just a lot slower.
Total full-frame motion distance currently looks like this (before curating any further). Would it be worth parameter searching on a subset of these, or even just throwing away higher motion micrographs altogether?
Distribution looks like I’d hope to see, so unless through bad luck it’s picking from both extremes (unlikely…) that shouldn’t be the cause…
Is the 1080 pixel box downsampled at all? I have had great success with 1050 pixel boxes (downsampled from 1400 pixels as NU refine can’t manage boxes that large) but if you’re downsampling from a larger box, it might be struggling there. Also, what are the specs of the system? RBMC is more frugal than Bayesian polishing for system memory usage, but can still use quite a bit!
There’s no downsampling at moment - 1080pix at 0.651Å/pix.
1080pix is actually a bit tight for 500Å particle, at this resolution and defocus range (average 1.1um).
Could try downsampling e.g. 1200–>1050 (0.744Å/pix).
The system has 2xA40, 512GB RAM (have been requesting all available RAM when troubleshooting). I haven’t successfully run NURefinement yet, due to abnormal termination error I think described elsewhere. That’s a separate issue, but a smaller box would potentially help both.
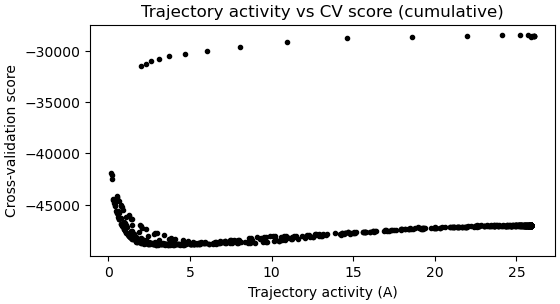
@cryob I’m late to this discussion - presumably you already tried a looser mask? One thing that I notice is that the box seems very big for the achieved resolution - all the signal in the FCC plot (which doesn’t even look that odd, honestly) is in the lower frequencies. You might try the following (if you don’t want to f-crop the particles ahead of time):
There’s a parameter called “Fraction of FCs to use for alignment” in the hyperparameter optimization section. This controls what fraction of the fourier components are used for estimating trajectories, with the remaining (higher) frequencies being used for cross-validation (to decide whether a given hyperparameter triplet is good or not). If there isn’t any signal in the top half of the resolution range, the cross-validation score has nothing to work with. You might try setting it to 0.3 or something.
Similarly, there’s a parameter “use all fourier components” in the empirical dose weight section. If this weirdness is because the high frequencies are too empty/noisy and messing up the fit, you could turn this parameter off, in which case you’ll only fit against the subset of the fourier components that were used for alignment during hyperparameter optimization.
You don’t necessarily need to try both at the same time, though the hyperparameter optimization does look wonky so I’d definitely go after that first.
@rbs_sci - I’ve now tried extensive search with a soft edge spherical mask to the edge of the box (running with no connected mask gave the message that a mask must be provided).
This was also on curated set of micrographs (with higher particle numbers and good CTF fit resolution).
So I think using a loose mask has helped a bit, and/or curating micrographs.
@hsnyder - Thanks for these suggests. I agree about the signal in the FCC plot. The homorefinement resolution and map quality suggests that the high frequency information is there, but yes maybe just too noisy.
I’ll try changing the fraction of FCs in hyperparameter search. Is there a good way to estimate an appropriate value (e.g. 0.3) based on the FCC plot? Ideally I would try several values but the run times are very long.
Alternatively, can we manually select “best” hyperparameters from looking back through the search iterations?
Given that the spherical mask above is now giving a better FCC model fit, are we justified in using all fourier components in empirical dose weighting (leaving this switched on)?
For what it’s worth, exiting early isn’t necessarily a sign of a problem, it’s an optimization to avoid wasting time when you’ve already reached a point that we know can’t get better.
So I think using a loose mask has helped a bit, and/or curating micrographs.
My guess would be the curation was the dominant factor here, but interesting to know!
Is there a good way to estimate an appropriate value (e.g. 0.3) based on the FCC plot?
Unfortunately I don’t know of any way more principled than eyeballing the FCC plot and choosing some percentage of the distance across the horizontal axis that still leaves a good chunk of signal above it.
Alternatively, can we manually select “best” hyperparameters from looking back through the search iterations?
Yes you can! But since the cross validation scores are inaccurate when there’s inadequate signal in the high frequency band, you’re sort of guessing at what triplets will be good.
Given that the spherical mask above is now giving a better FCC model fit, are we justified in using all fourier components in empirical dose weighting (leaving this switched on)?
For this case, now that the FCC model fit looks good, I wouldn’t be worried about using all FCs.