RBMC & Refinement Noise Model

Hi, good morning afternoon evening.

RBMC consistently provides better NU-refinement FSC results in all my cases, compared to patch-motion, RELION implement motion or local motion corrections etc…

Additionally, in every instance, RBMC modifies the noise model curve and B-factor Guinier scale. Interestingly, I’ve never observed the noise model graph with a curve, even after reference based per-particle motion correction like Polishing and importing particles into cryoSPARC to NU-refine.

While I’m not well-known in the mathematical algorithms behind RBMC and other tools, I’m just curious why does RBMC affect these factors when previous motion correction tools do not? and is it good to estimate the 3d model or map sharpening ?

Thanks

2 Likes

Hi @Jadyn! Thanks for the question!

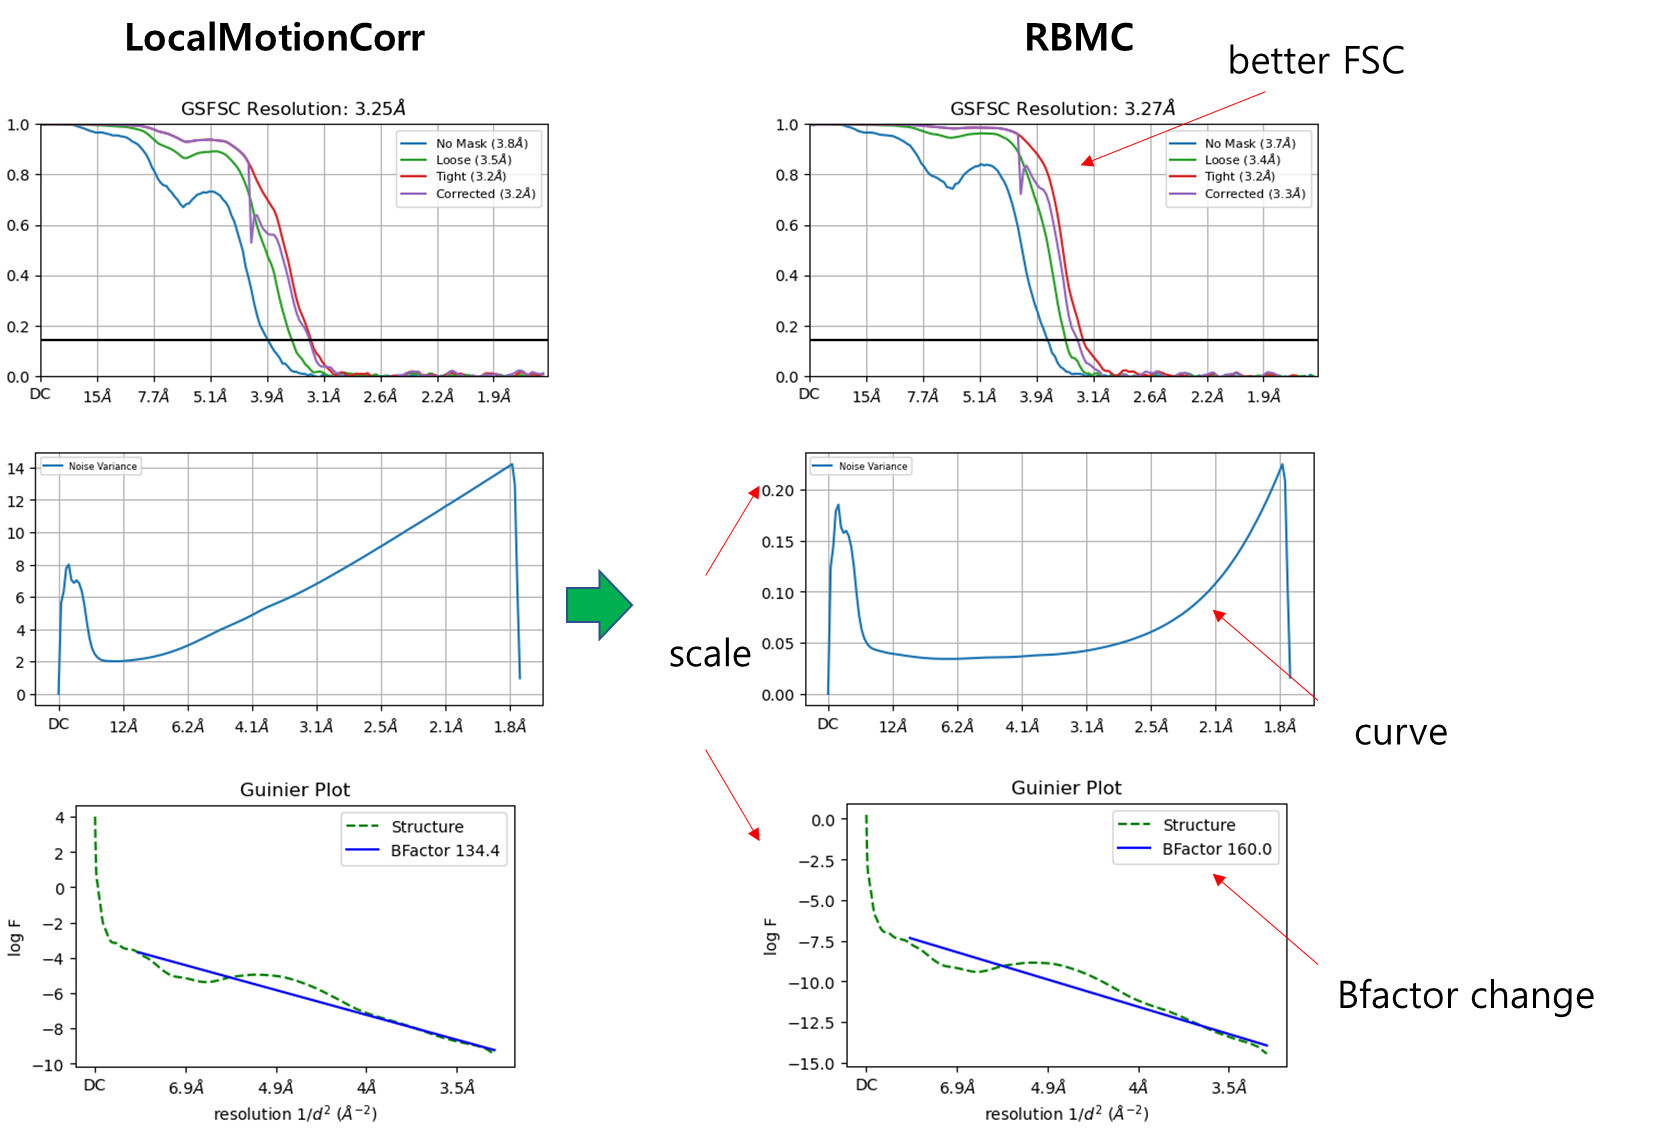
In general, we would expect both the noise model and Guinier plot / B-factor to change.


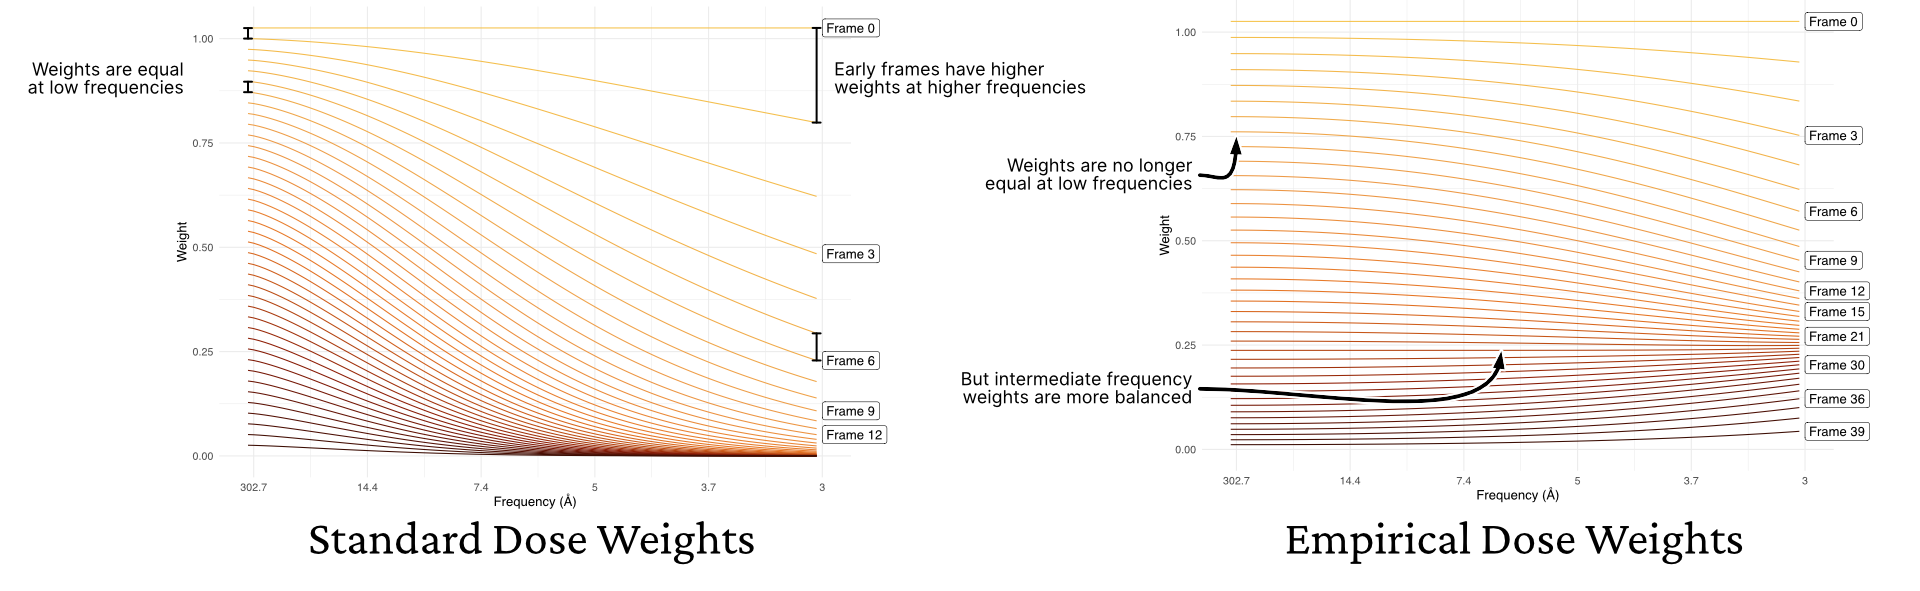
To understand the effect on the noise model, consider the difference in dose weights before and after RBMC:

In this plot, I’ve stacked the relative weight of each frame on top of each other, for each frequency. Thus, the gap between two lines indicates the weight of the top line.

On the left, we see that with standard dose weights (like those applied during patch motion correction), all the frames are weighted equally. However, the contribution of the late frames rapidly falls off as frequency increases.

The empirical dose weights calculated by RBMC (right) show a very different pattern, in which later frames have a higher weight at middle frequencies (the recovery of late frame weighting at high frequencies is the issue reported here – we don’t understand why this happens yet).

Now, considering the effects this difference has on the noise model. As we increase the contribution of each frame, we expect the standard deviation of the final particle images to be reduced, since the noise of a greater number of frames is being averaged together to produce the final image. As the weights decrease at high frequencies, you see the sharp increase you’ve noted, since the weights are returning to a shape similar to that of the standard dose weights.

Of course, the lower noise modeled in intermediate frequencies is not an unalloyed good — it may be that you’re simply averaging together more noise without adding more useful signal. This depends on the overall quality of the RBMC results.


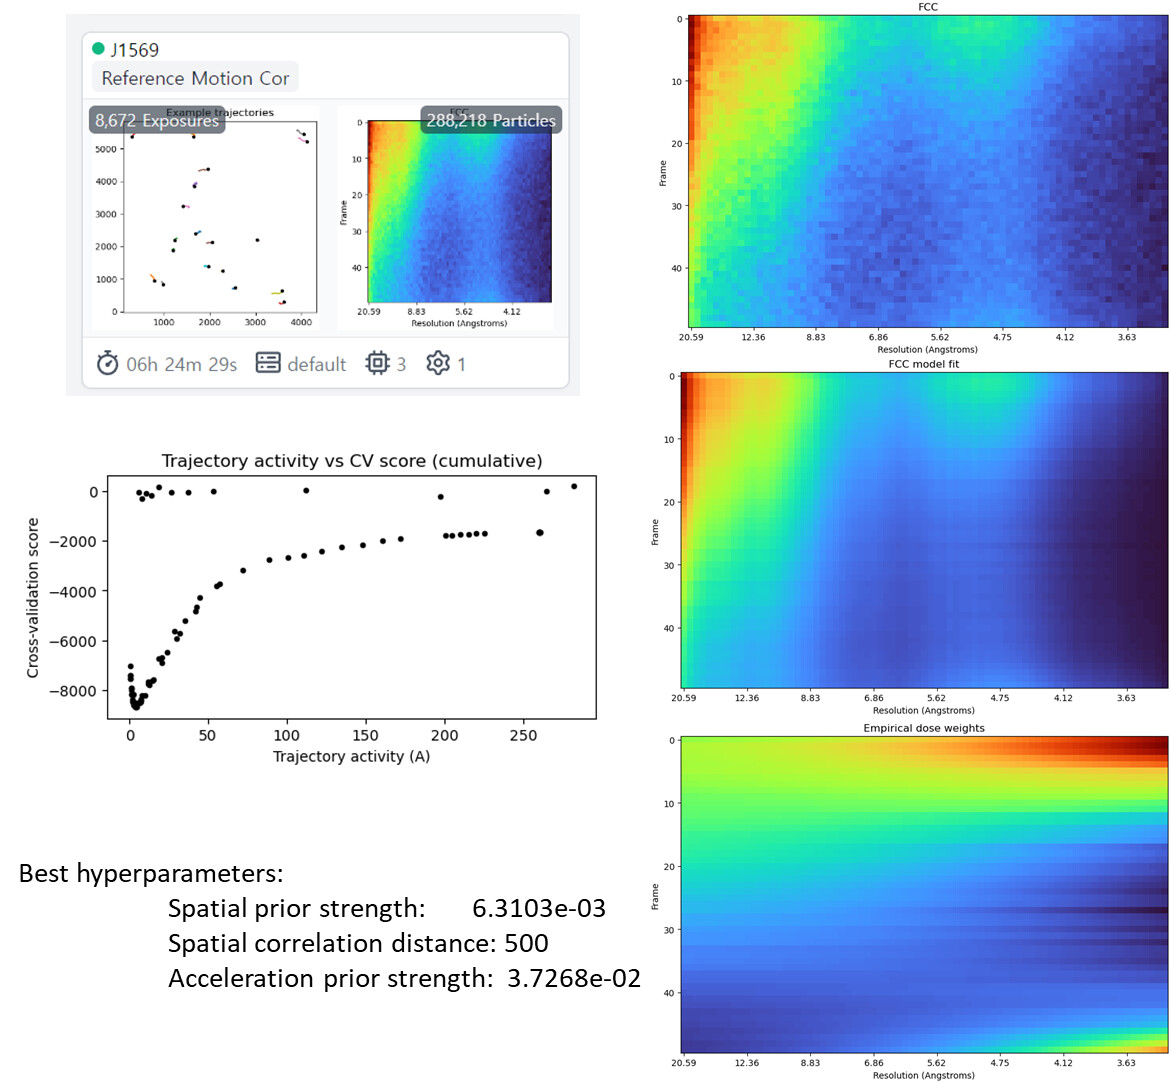
As for the B-factor, we also would expect this to change, but we’re surprised to see a greater B-factor after RBMC. Could you share with us your dose weight and FCC plots? They appear just before the particle trajectories in the Event Log.

2 Likes

Hi @rposert
Thank you for kindly explaining this question!

Sure,
Here is the RBMC information about this issue. As you mentioned, and as also reported by others, the recovery of late frame weighting at high frequencies has been observed.
I am currently comparing the NU-refinement B-factor changes for other case!
I will update soon~

Here is another dataset comparison, with and without RMBC, using the same Titan Krios with K3. But, the FCC, FCC model fit, and dose-weights appear similar in both dataset (above reply).

It also shows a slight improvement in the FSC (indicated by the red arrow), but there is a decrease in the B-factor.

I’m unsure if this motion correction is suitable for further processing. My focus is on a very small region for ligand binding, so I’m curious about that this correction or NU reconstruction affects my ligand density

Hi @Jadyn, thanks for sharing that information. We think what may be happening here is that there are too few particles per frame, which is resulting in the horizontal striping artifacts you see in the FCC model fit and empirical dose weight plots. We think that increasing your total number of particles (perhaps try doubling to 40k?) will help resolve these issues.

Would you mind trying that and letting us know?