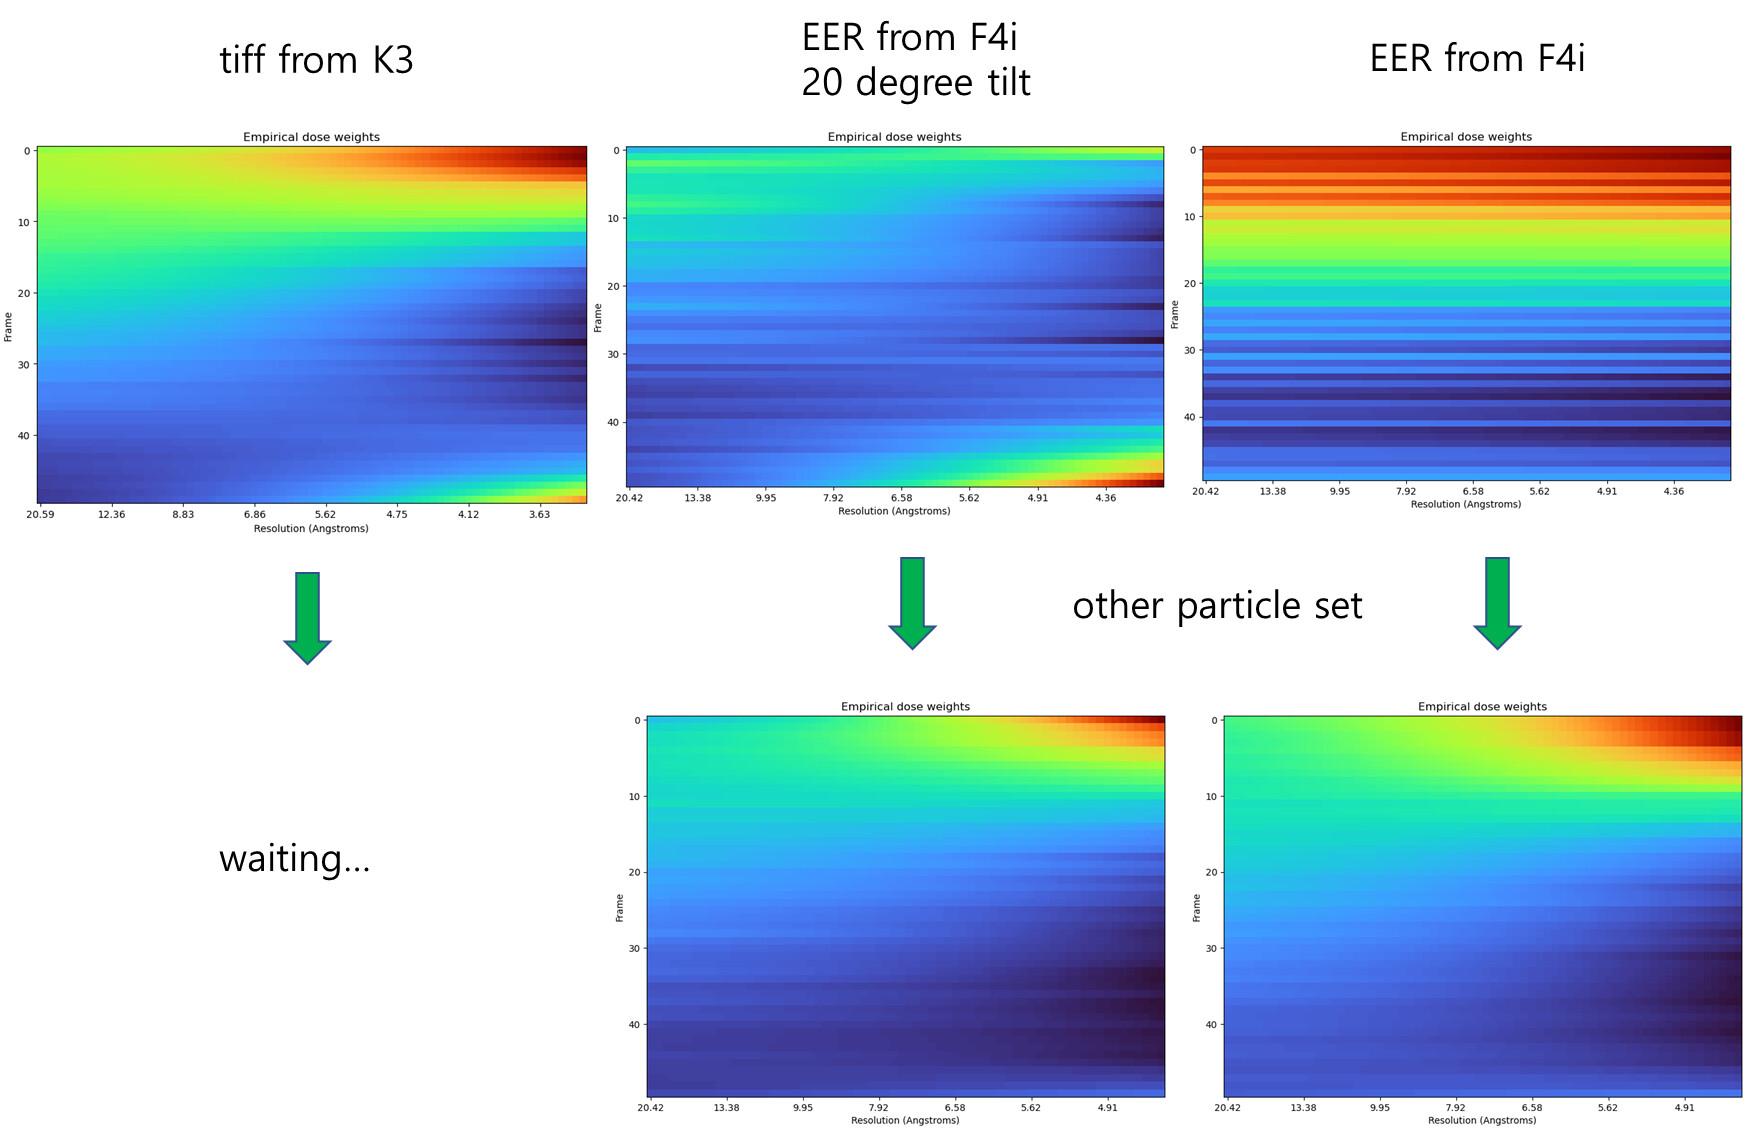
I encountered these plots in data from both EER and Tiff datasets, using Quantifoil 1.2/1.3 carbon grids, with the usual total dose of 50 ~ 60 and 0.8 ~ 1.0 Å/pixel conditions, AFIS
Initially, I applied patch motion correction ~ Topaz picking, followed by 3D refinement as usual. In my samples, there’s no significant heterogeneity in the protein, and the quality appears quite good, almost up to the final particle sets. Therefore, I ran the RBMC with only one 3D model and its particle set.
But, in all cases, not only did I observe the same phenomenon, but I also noticed other odd dose weights in RBMC.
However, I altered the particle set and only re-run the dose weighting estimation.
(more 3D classifications to minimize the partial particles and any slight heterogenous populations as much as possible)
After these adjustments, the problematic graph disappeared, and the results looked as good as those in the RBMC tutorials.
In this case, before RBMC, would it be good to calculate the hyperparameter and dose weight using only the high-quality particles, and then apply motion correction with these parameters to the original particle set, similar to the Polishing process?
In this case, before RBMC, would it be good to calculate the hyperparameter and dose weight using only the high-quality particles, and then apply motion correction with these parameters to the original particle set, similar to the Polishing process?
This sounds like a good idea IMO.
Those graphs really do look quite odd. If you still have them, could you post the FCC plots and the FCC model fit plots as well? I’d be interested to see if they reveal any clues as to why the dose weights are that bad. Also, how many particles are in the larger (problematic) dataset? And, did you by chance change the parameter that controls how many particles are used in the dose weight calculation from it’s default value?
Hi @hsnyder,
Sure,
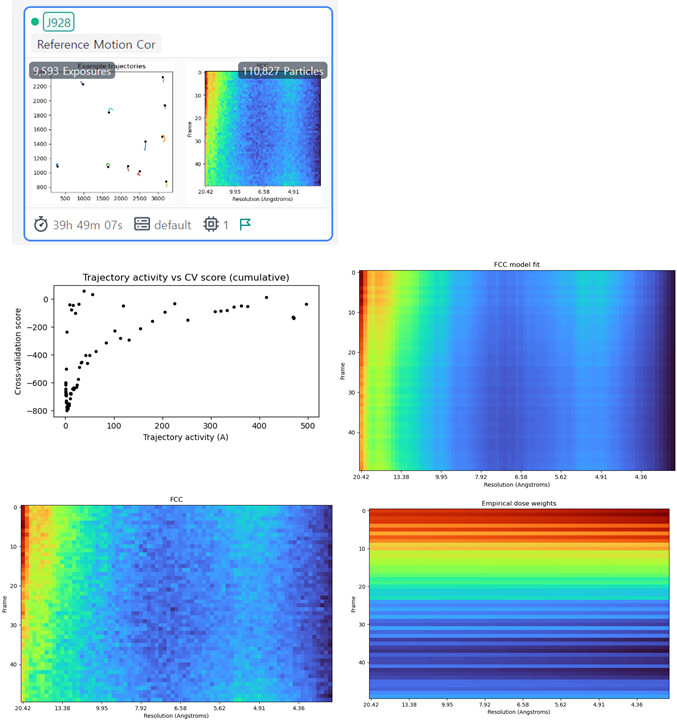
here are the FCC plots for the third sample (perhaps the strangest one?), which is an EER from F4i, zero degree tilt.
All RBMC settings were default, involving 110,827 particles on 9,593 exposures.
And,
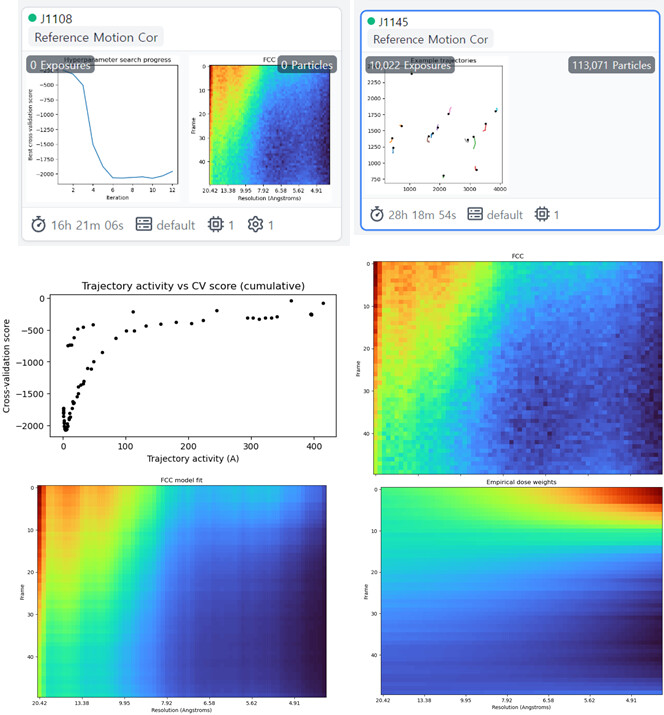
This is an improved RMBC job of the same exposure set, but with a different particle set. The number of exposures is slightly different, totaling 10,022, likely due to the inclusion of some new particles
I split the reply due to the large size of the figures and avoiding confusion.
I’ve been exploring other options to improve the RBMC. However, I observed a similar pattern of dose weights (with an increase around the high frequencies) in the TIFF data from the K3 case, despite using a different, more classified particle set such as the EER case
Unfortunately, another protein target dataset from Titan/F4i is also exhibiting the same problem, showing no improvement similar to the TIFF case. This leads me to believe that the issue might not be related to the data type, at least
I’m not sure why improvements only occurred in this EER dataset case .
Hopefully, the reason behind this issue will be understood soon, and these odd calculations will be resolved.
Hi @Jadyn, thanks for your investigative work. I was expecting the FCC plots to look worse than they actually do, but they do seem a little bit on the noisy side. I might recommend that you increase the “target number of particles” parameter in the dose weighting section from it’s default value of 20,000 to perhaps 30,000 or 40,000. My thinking here is that the relatively high number of frames coupled with the SNR of this data is causing some regions of the FCC to be noisy, leading to the striping effect that we’re seeing.
It looks like you might already be doing this, but just in case you’re not aware, you can split the reference motion run into separate jobs, one to do hyperparam search, one to do dose weight, etc. The procedure is explained in the cryosparc guide, and can help with reducing the turnaround time on tests like this.