Hi,
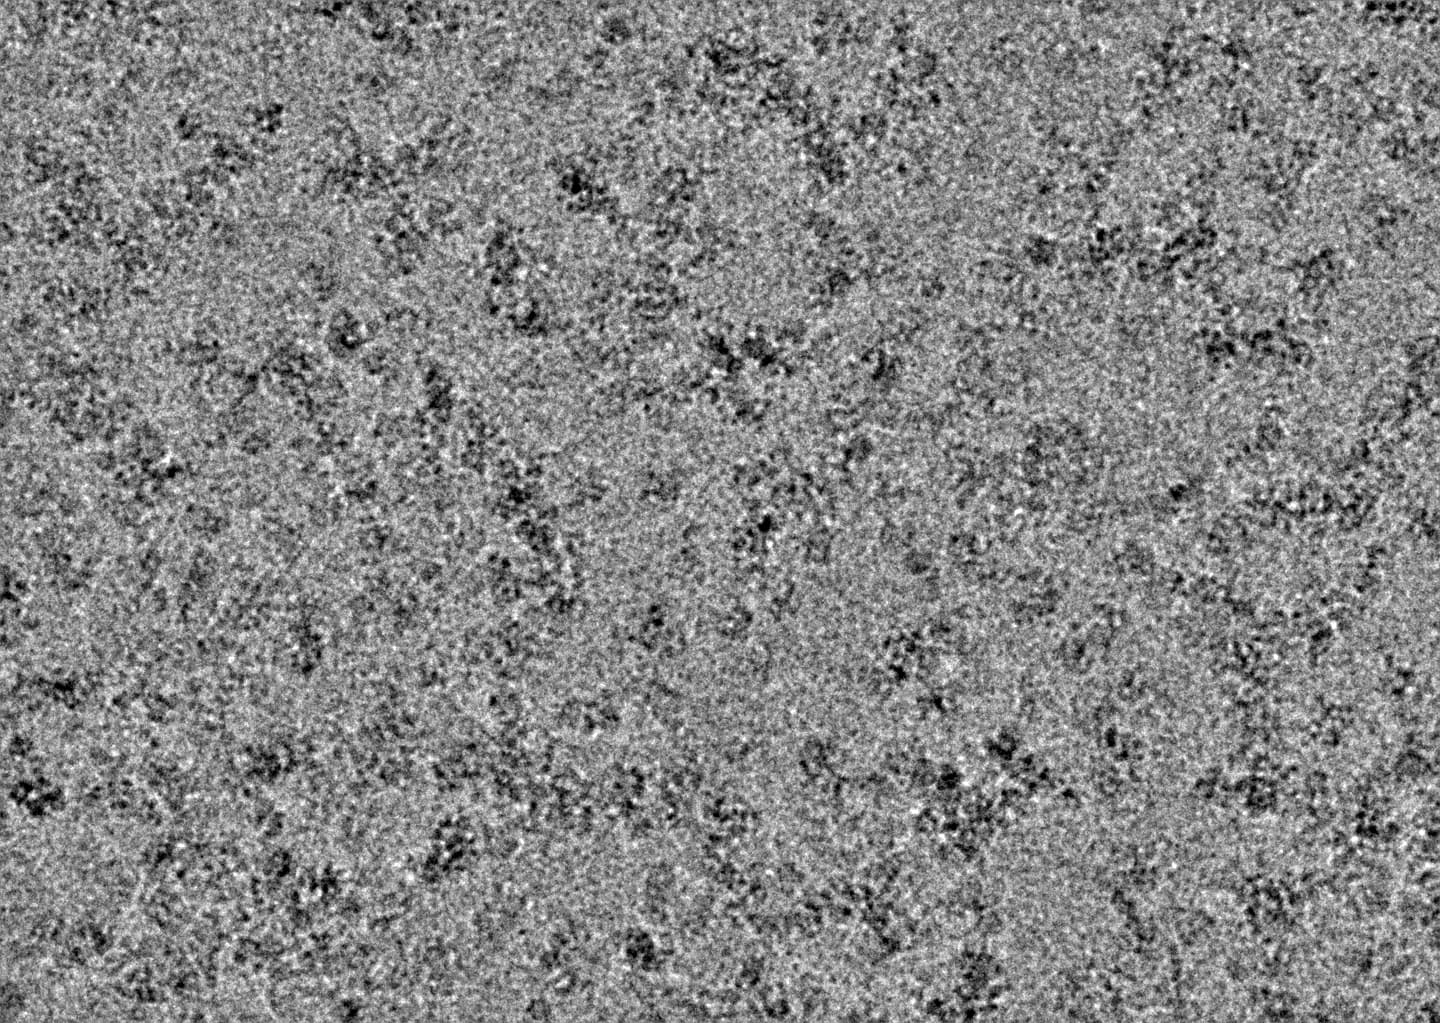
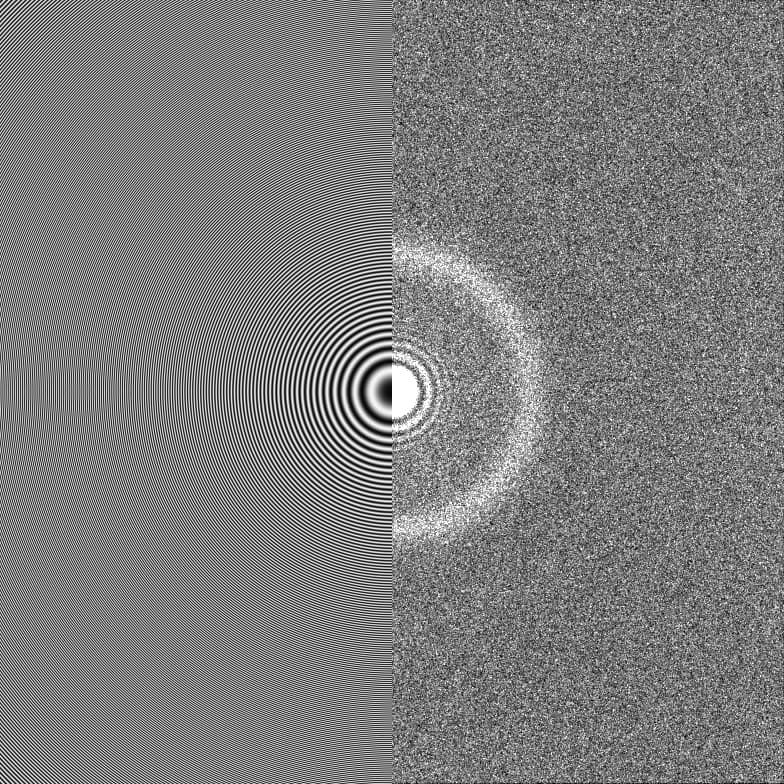
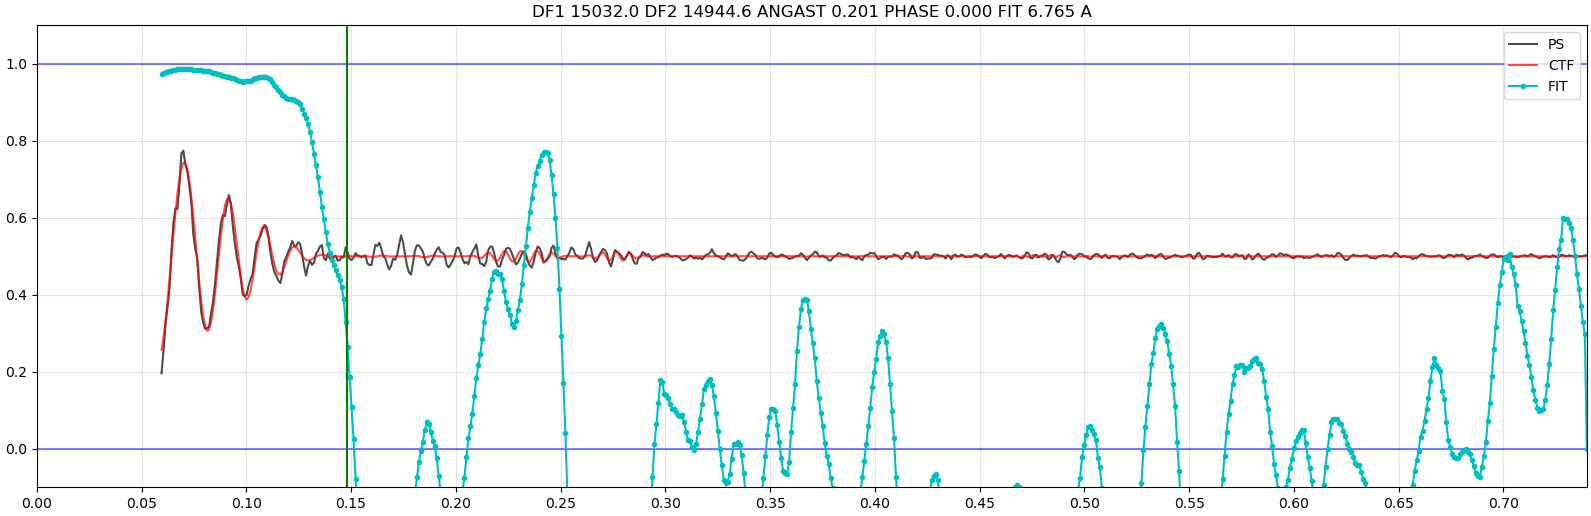
I’m processing a dataset where the micrographs quality look ok by eyes but in the patch CTF estimation job, the fit resolution of the majority of the micrographs are within 6-7.5 A. I had this same issue with some other datasets I collected previously on different samples. Others who collect datasets using the same microscope don’t seem to have this issue persistently like me. I’ve uploaded an example micrograph image with its 1D & 2D CTF. I’d appreciate any suggestions or ideas on this matter. Thank you!
extremely frustrating, I know. your power spectra indicates low signal. 1) increase concentration of sample on grid. in this case you’re already pretty good, but could probably double it and have a “lawn” of protein. 2) collect over thinner ice. the “lawn” of protein should help make uniformly single-particle thick ice more frequent. 3) increase flux and/or dose. this is a guess on my part. 4) it’s possible, but somewhat impractical, to add a scattering factor like a very small 5-10kDa protein to the grid in addition to protein of interest. would consider this last-resort. 5) do you have undesired buffer components like glycerol/detergents etc? 6) do you tune the beam between sessions, i.e. is it possible that others use different and more appropriate microscope settings? 6) can you use the LIVE browse function to identify the best CTF and see if there is a single other factor (astigmatism, rel ice thickness, particle count, other) that correlates? plot CTF in X and each other factor individually in Y to see if there are trends.
@CryoEM2 Thanks for your response.
The sample is a membrane protein in detergent micelle (GDN) and I also add 0.05% OG before freezing grids to prevent aggregation.
I don’t think others use better settings because the microscope is operated by an operator and the settings are the same usually.
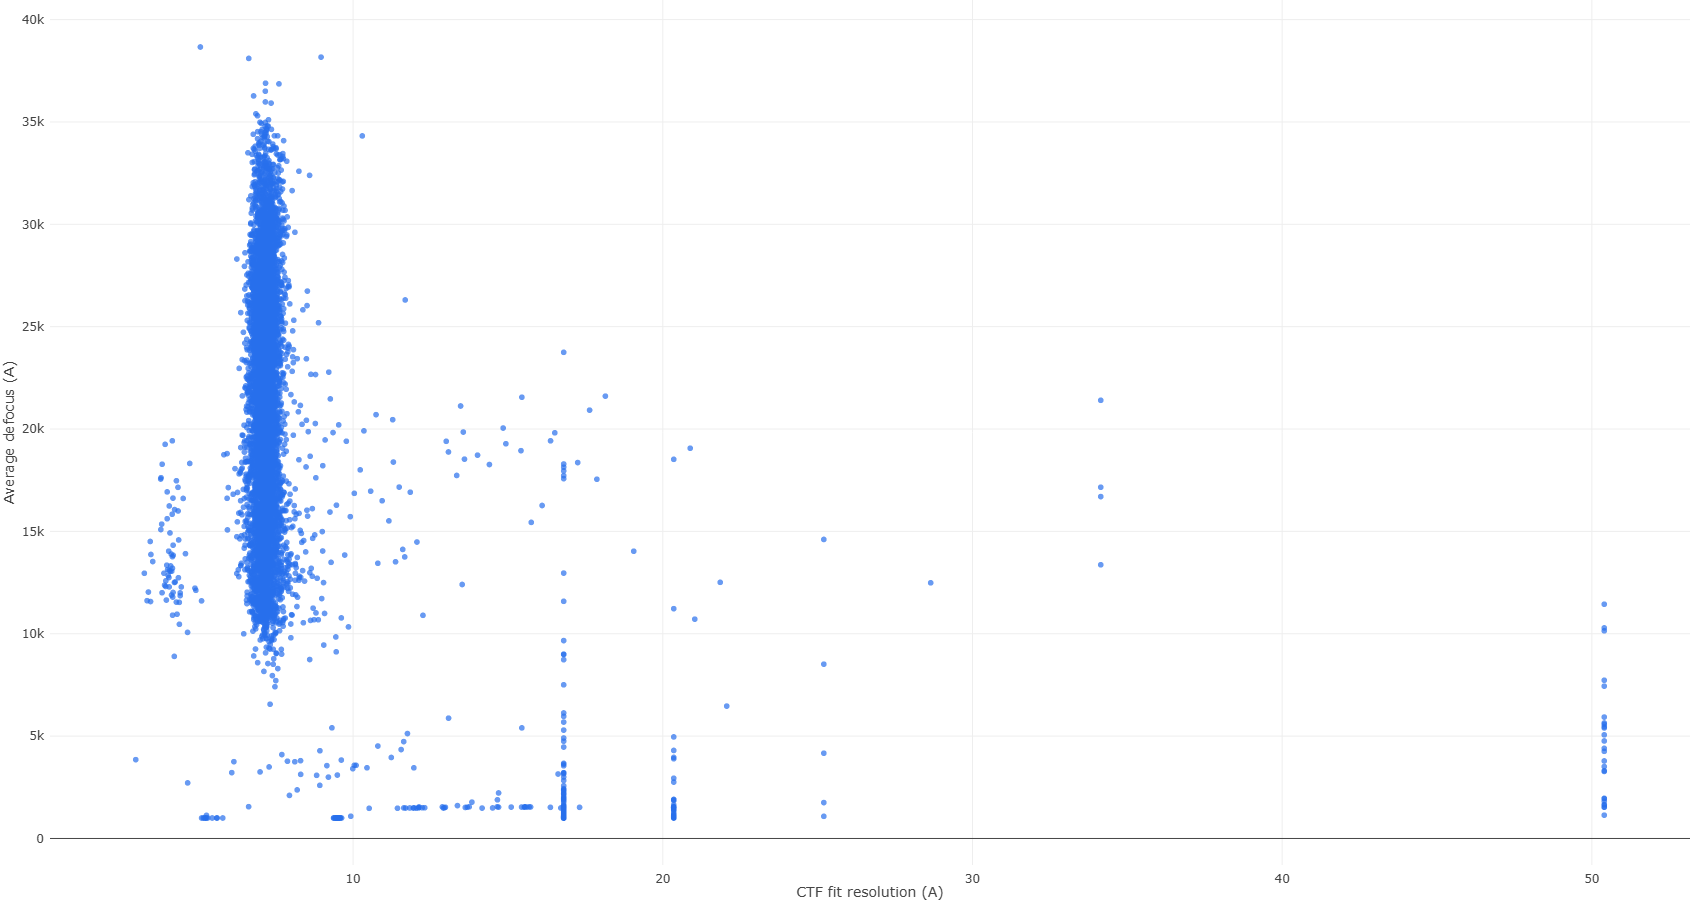
From curate job it seems that micrographs with better fit resolution have lower average defocus but that doesn’t seem conclusive as there are many other micrographs where average defocus value is in the same region but they have poor CTF fit.
As for you concentration point, I’m a bit worried about aggregation if I increase the concentration further. I feel already I see some aggregation on the grids but I’m not sure how hurtful it is.
Thank you again!
have you tried other CTF estimation routines - warp, ctffind? do you have old datasets prior to adding betaOG with good CTF? low defocus always correlates with better resolution, but that is not at the scale of what we’re seeing here. I have little expertise but strongly suggest this is an issue with the GDN and OG and I know they are important but are likely the cause of the issue here. I suggest exploring this: match to existing protocols, try tweaking the balance of good particle shape and homogeneity vs lowering the concentrations of these buffer components and/or another purification step, curate exposures to include only the good CTF ones and see if anything is obviously different, seek out incredibly thin ice (largest possible squares in the atlas), and increase blot time/force to get thinner.
OG can be pretty denaturing for a lot of membrane proteins. Hard to say if that is an issue for you at this concentration which is pretty low but I would be careful. We typically add fluorinated OM to help spreading if we are using a detergent for this purpose. The fluorinated detergent is not supposed to mix with the hydrocarbons of the detergent you use for purification.
If I had to guess from your CTF fit and image, you have likely collected on some thick ice. This can be difficult to judge but generally speaking unless there was some major problem with how the scope was setup this is usually the reason. It will be very hard to reach high resolution for such a sample unless you collect in minimally thin ice. So you may want to optimize your grid conditions to get this kind of ice.
Do you have an energy filter on your scope? I usually use this to gauge my ice thickness, ie if my dose over vacuum is 50 e/Ans^2, then ideal ice for a small membrane protein < 100 kDa is generally about 43-45 e/Ans^2 with an energy filter. What we see is for suboptimal ice, would be about 38-39 e/Ans^2 and the CTF fits would be poor, ie worse than 4 Ans. In ideal ice, 2.8-3 Ans or better would be typical with a well-setup scope.
1 Like
@jcoleman
I was also concerned about using OG, so did gel-filtration with with the sample after OG addition and I didn’t notice any aggregation or denaturing of the protein. But I’ll try F-OM, thanks for the suggestion.
I believe you are right about the dataset being collected on thick ice as the microscope operator tends to collect on somewhat thicker ice not to have drift issues. I think for the next data collection session I should be careful with that.
2 Likes