Hi all!
Previously, we’ve been having great success with RBMC on our grids. Typically, we get plots looking like this on the first round of computing dose weights:
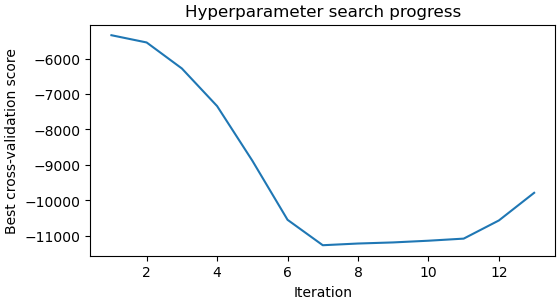
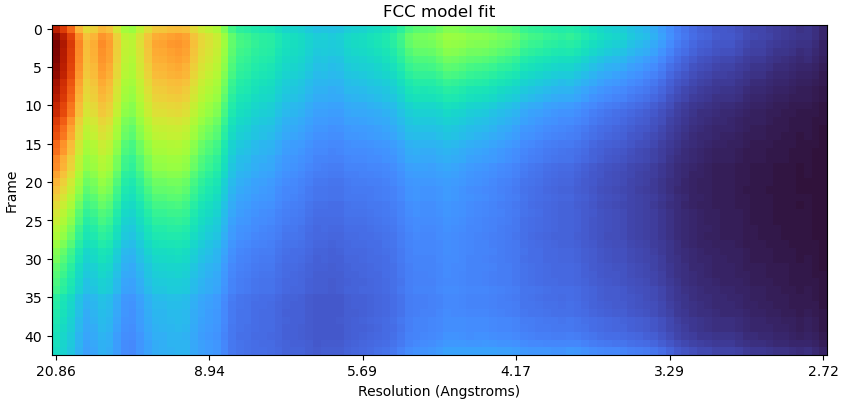
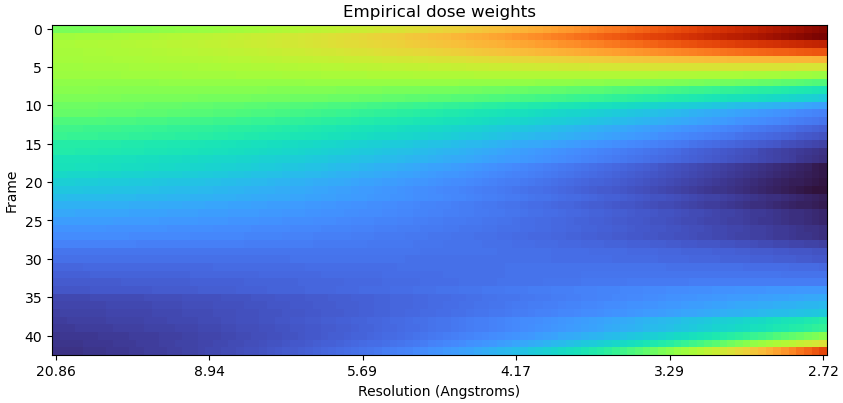
(There is the problem with high dose weights in later frames, but I was successful in fixing this using the tutorial here).
However, in our most recent dataset, RBMC seems to be giving very weird results, and seems to make the resolution worse, e.g.:
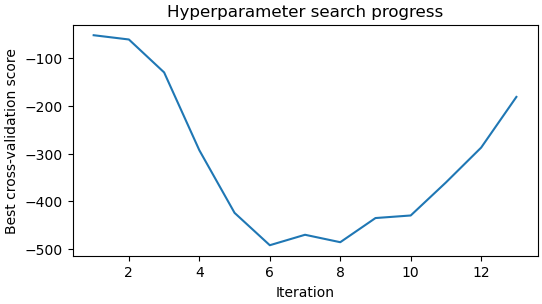
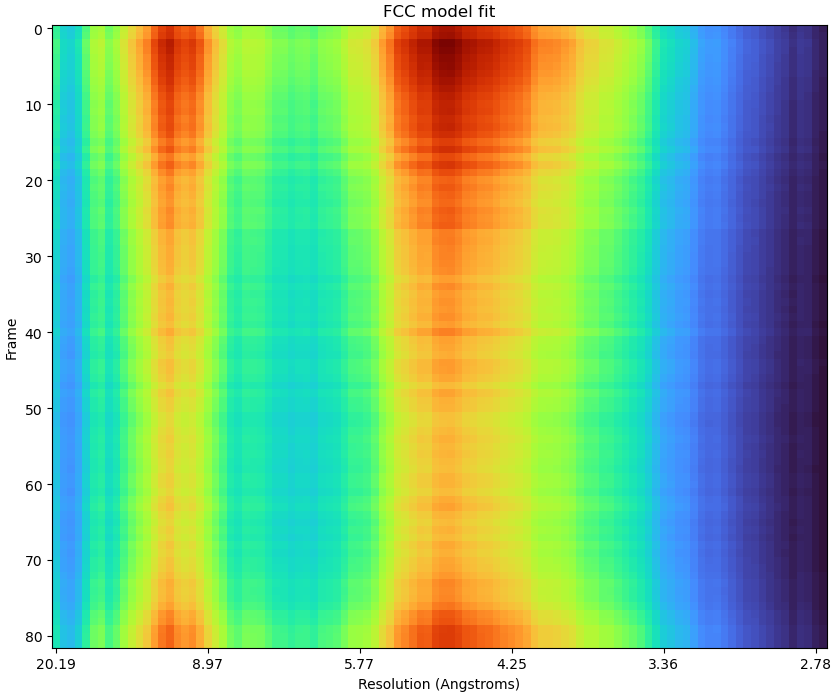
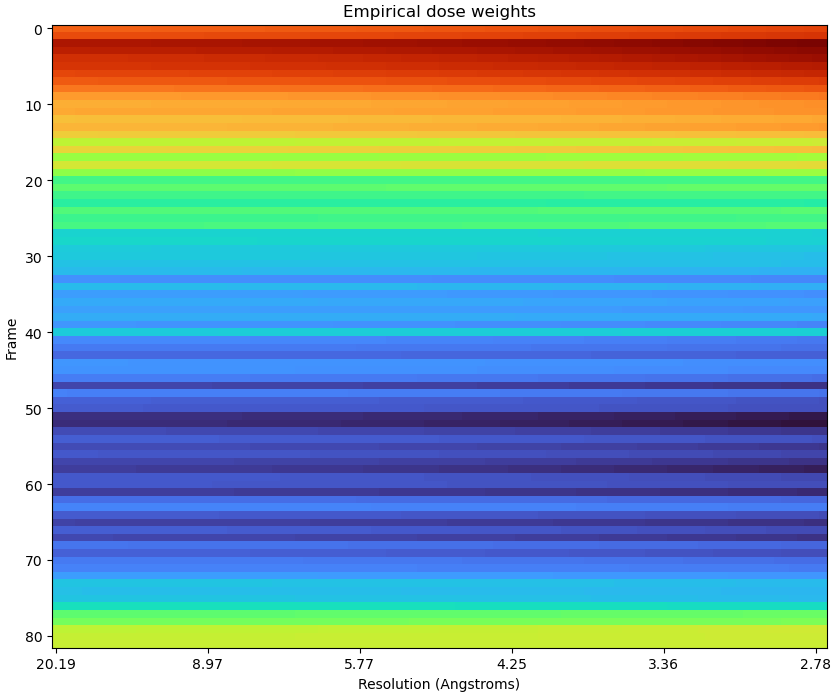
The CV scores seem to be very poor, and I’m confused why the dose weight plot is so identical over different resolutions.
The grids are of the same protein, albeit in a different detergent which causes a lot of preferred orientation and hence for half of our collection time we imposed a tilt of 25 deg (furthermore, this time I used Rebalance Orientations and Subset Particles by Statistic to clean up the particle stack).
However, probably the most important difference in this new data is that, as you can see from the y axis, we unintentionally collected the data with 83 frames, rather than our usual 44. The total dose was still 50 e/A^2, so now our dose per frame is almost half that what it should be.
Could this be the reason the RBMC is not working as expected? Is there a way to improve the result?
Many thanks!
Louis