Hi @olibclarke, good questions!
Here’s a more formal, thorough explanation of how we calculate the power score. First, let’s set up a few things:
- First, take the background-subtracted micrograph and square its values. The background estimation is performed during Patch Motion Correction. For convenience, I will call this squared, background-subtracted micrograph the “intensity micrograph”.
- Create a soft, circular mask. The inner radius is the minimum particle diameter, the outer radius is the maximum particle diameter.
Now, to calculate the power score for a given pixel (that is, a potential pick location) we calculate the sum of the pixel values in the intensity micrograph centered at the given pixel, weighted by the mask.
With that out of the way:
What defines the background radius out of interest? A circle 20% larger than the window radius? Or is the background calculated per micrograph?
I think I confused things a bit in my first post, apologies. The background is the background estimated during Patch Motion Correction. So yes, it’s calculatd per micrograph.
the power score is calculated at each pixel, then averaged within the circle defined by the particle diameter, is that right?
Yes, the power score is calculated at each pixel. Since the score is a (weighted) sum of nearby values, it behaves a bit like an average, but formally it is just a sum as described above.
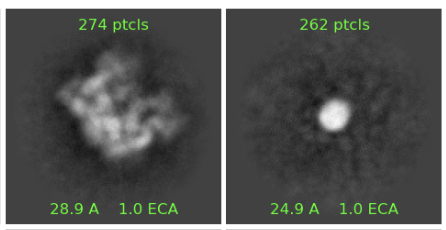
So that means even if two particles have different maximum power on a per pixel level, as long as it averages to the same value across the particle, they will have the same power? E.g. these two classes have particles with roughly the same power
is there a measure of the background variance, and/or the absolute background level? I am assuming the background is calculated per particle? This could be helpful for reducing picks on aggregated/crowded regions.
Yes, an image with 100 pixels of intensity 1 and an image with 10 pixels of intensity 10 will have the same power score. We do not currently record the per-particle “max power score”, nor do we record the per-particle background.
If you were interested in finding these numbers, you could, with cs-tools, calculate:
- the per-particle max power by performing the power score calculation described above, centered at the particle’s pick position, but instead of a weighted sum simply take the maximum
- the per-particle background by extracting the value at the correct pixel of the background micrograph. You can find the path for a particle’s background MRC in the
background_blob/path field.
Note that the background MRC is binned by the value found in background_blob/binfactor and is padded to be square. You can use the trimarray function to undo this padding, and you can find the micrograph’s original (not square, but also not binned) size in background_blob/shape.
I know that’s a lot of detail, but I hope that answers your questions!