Hi,
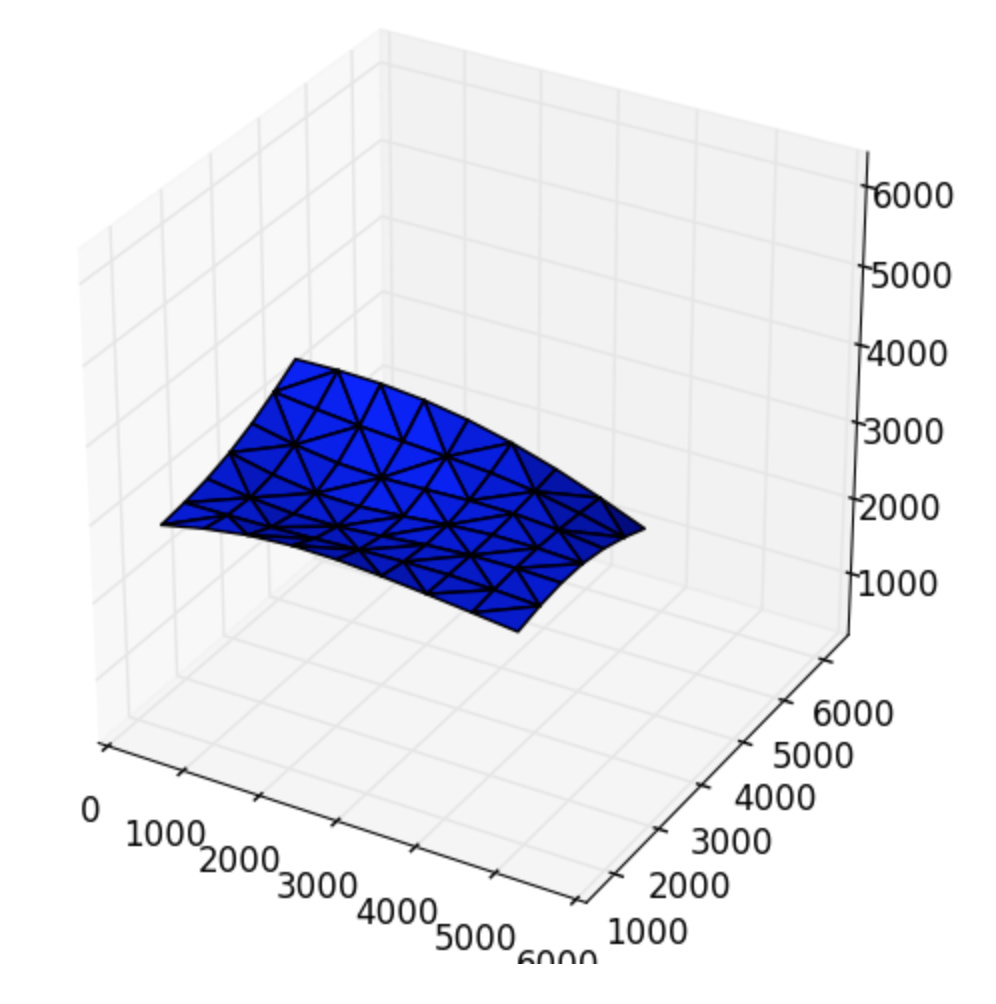
The 3D graphs generated by Patch CTF are pretty, and give a good qualitative sense of the data. It is very hard to derive anything quantitative from them, though.
Would it be possible to supplement them with a histogram of the local defocus values in the micrograph? Or just giving the min, max, and sd of the local defocus values would also be fine.
Cheers
Oli