Hi,
I have two suggestions for the orientation distribution plots which I think might improve ease of interpretation.
-
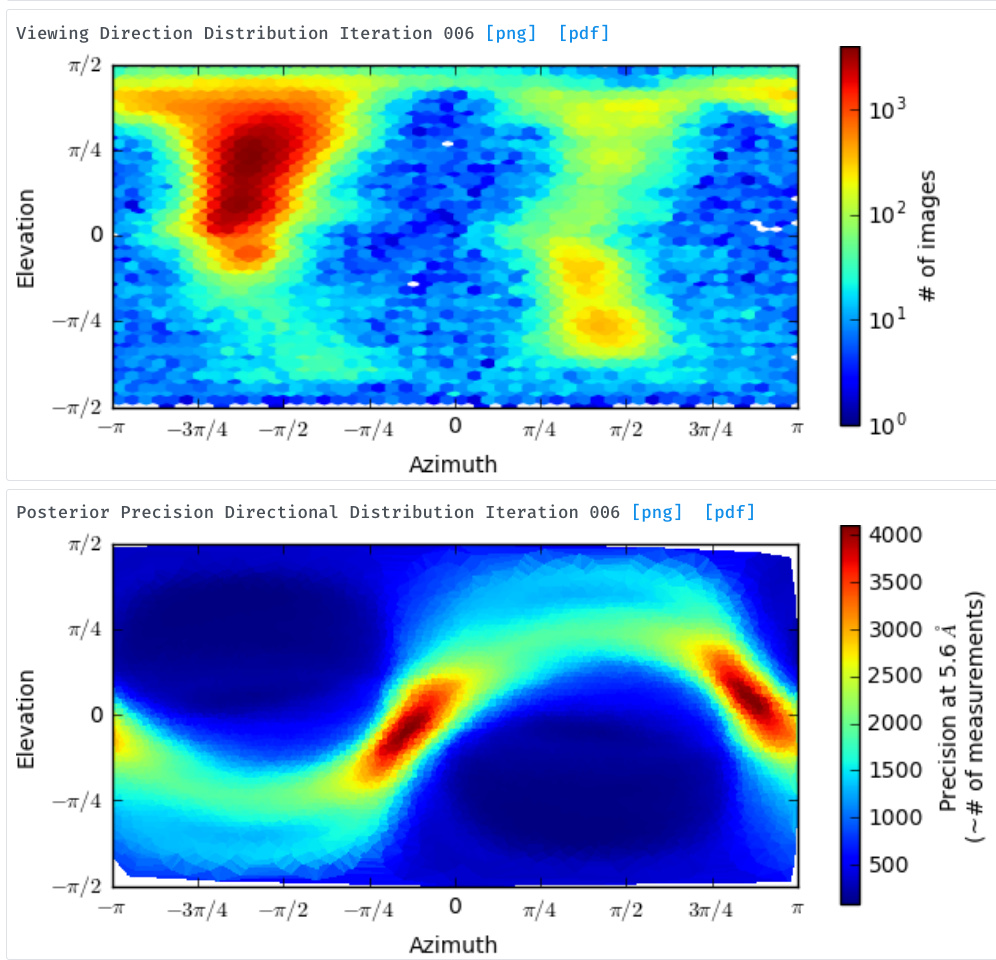
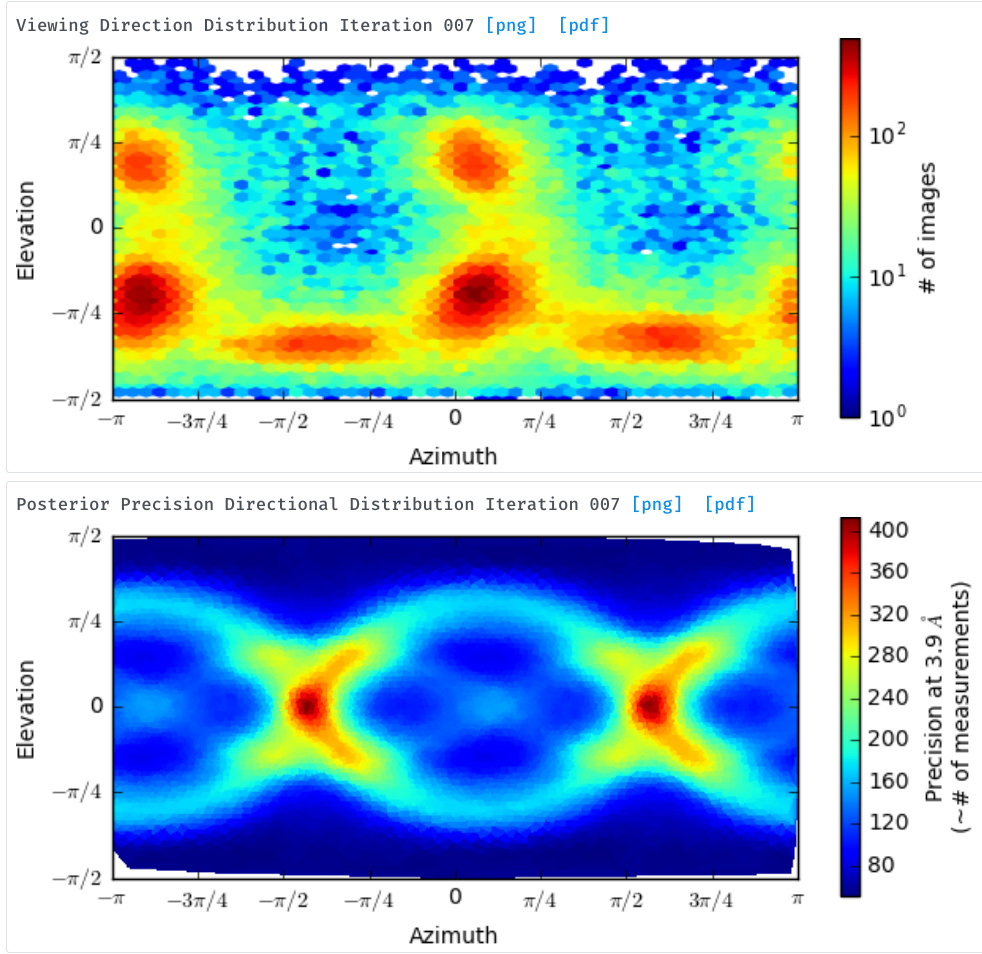
For the posterior precision directional distribution, unless one looks carefully at the scale, it is difficult to get an idea of whether it is a “bad” plot or a “good” one (e.g. see the two attached plots). This is because it is autoscaled such that the lowest value is blue and the highest value is red. Would it be possible to alter this plot (perhaps by plotting in terms of some kind of ratio between the min and max?) such that it can be put on an absolute scale? This would be helpful when comparing different experiments. It would be nice if plots representing structures with a large degree of anisotropy were instantly distinguishable, visually, from those calculated from a structure with a more or less isotropic distribution of views.
-
For the orientation distribution plot, this may be getting a little fancy, but for seeing which views are less represented, I think it would be really helpful to be able to hover over a point on the plot and get a thumbnail of the structure projected in that orientation, so one knows what to look for during 2D classification. With symmetric structures it is pretty easy to intuitively guess this, but less so for asymmetric structures.
Cheers
Oli