I just noticed today, using Orientation Diagnostics in conjunction with the ViewSelect application, that the Relative Signal Amount section of output shows the wrong coordinates for the middle Azimuth ranges. The ranges should be (-pi/2, 0) and (0, pi/2), but they are shown as (-pi/2, pi/6) and (pi/6, pi/2).
Hi @kevinj – thank you for reporting this, this is indeed a (plotting) bug.
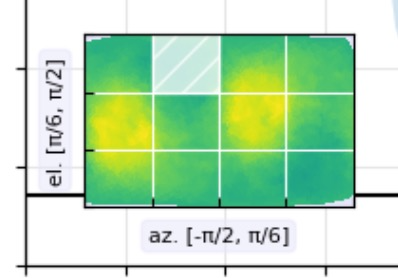
To be specific, here we divide the entire space (el: [-pi/2, pi/2], az: [-pi, pi]) into 12 subregions in a 3x4 grid. The selected region in the screenshot should have the limits of el: [pi/6, pi/2] (correctly displayed) and az: [-pi/2, 0] (incorrectly displayed but correctly stored internally). We’ve noted this and will fix in an upcoming release.
Valentin
1 Like