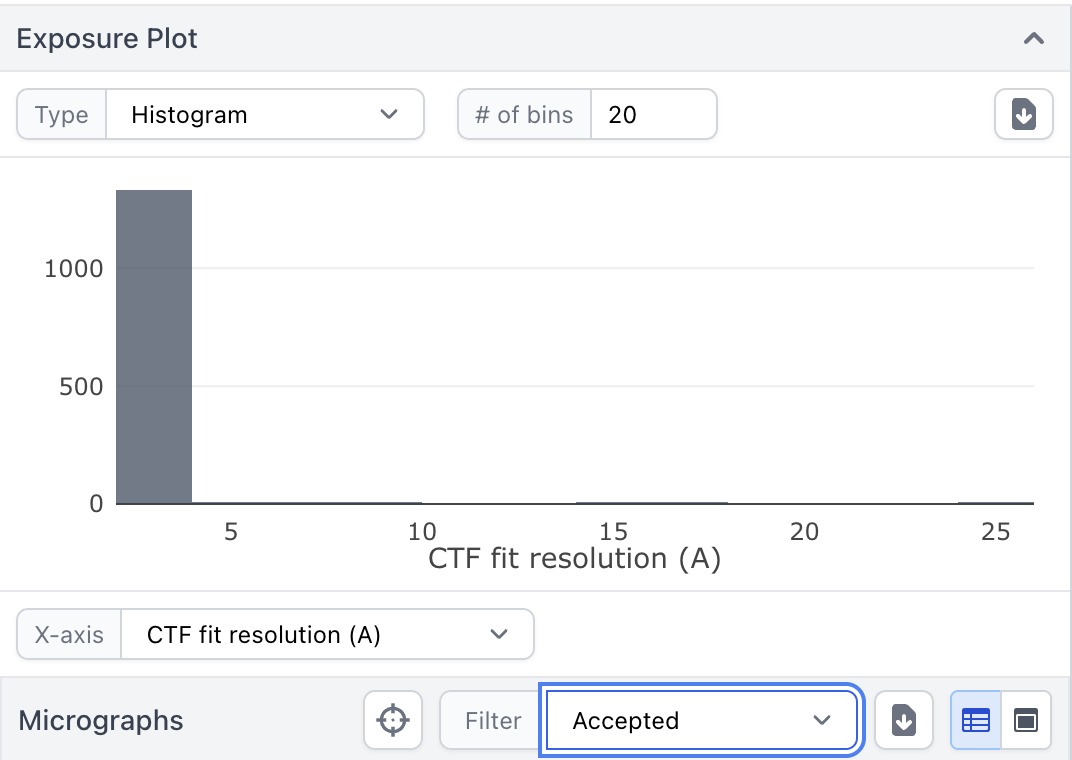
Often a few outliers can throw off the histograms or scatter plots in exposure curation to the point where they are not very useful for assessing the distribution.
It would be useful to be able to either (a) filter by accepted/rejected on these plots as is already possible for the table below or (b) manually set the axis limits for the display.
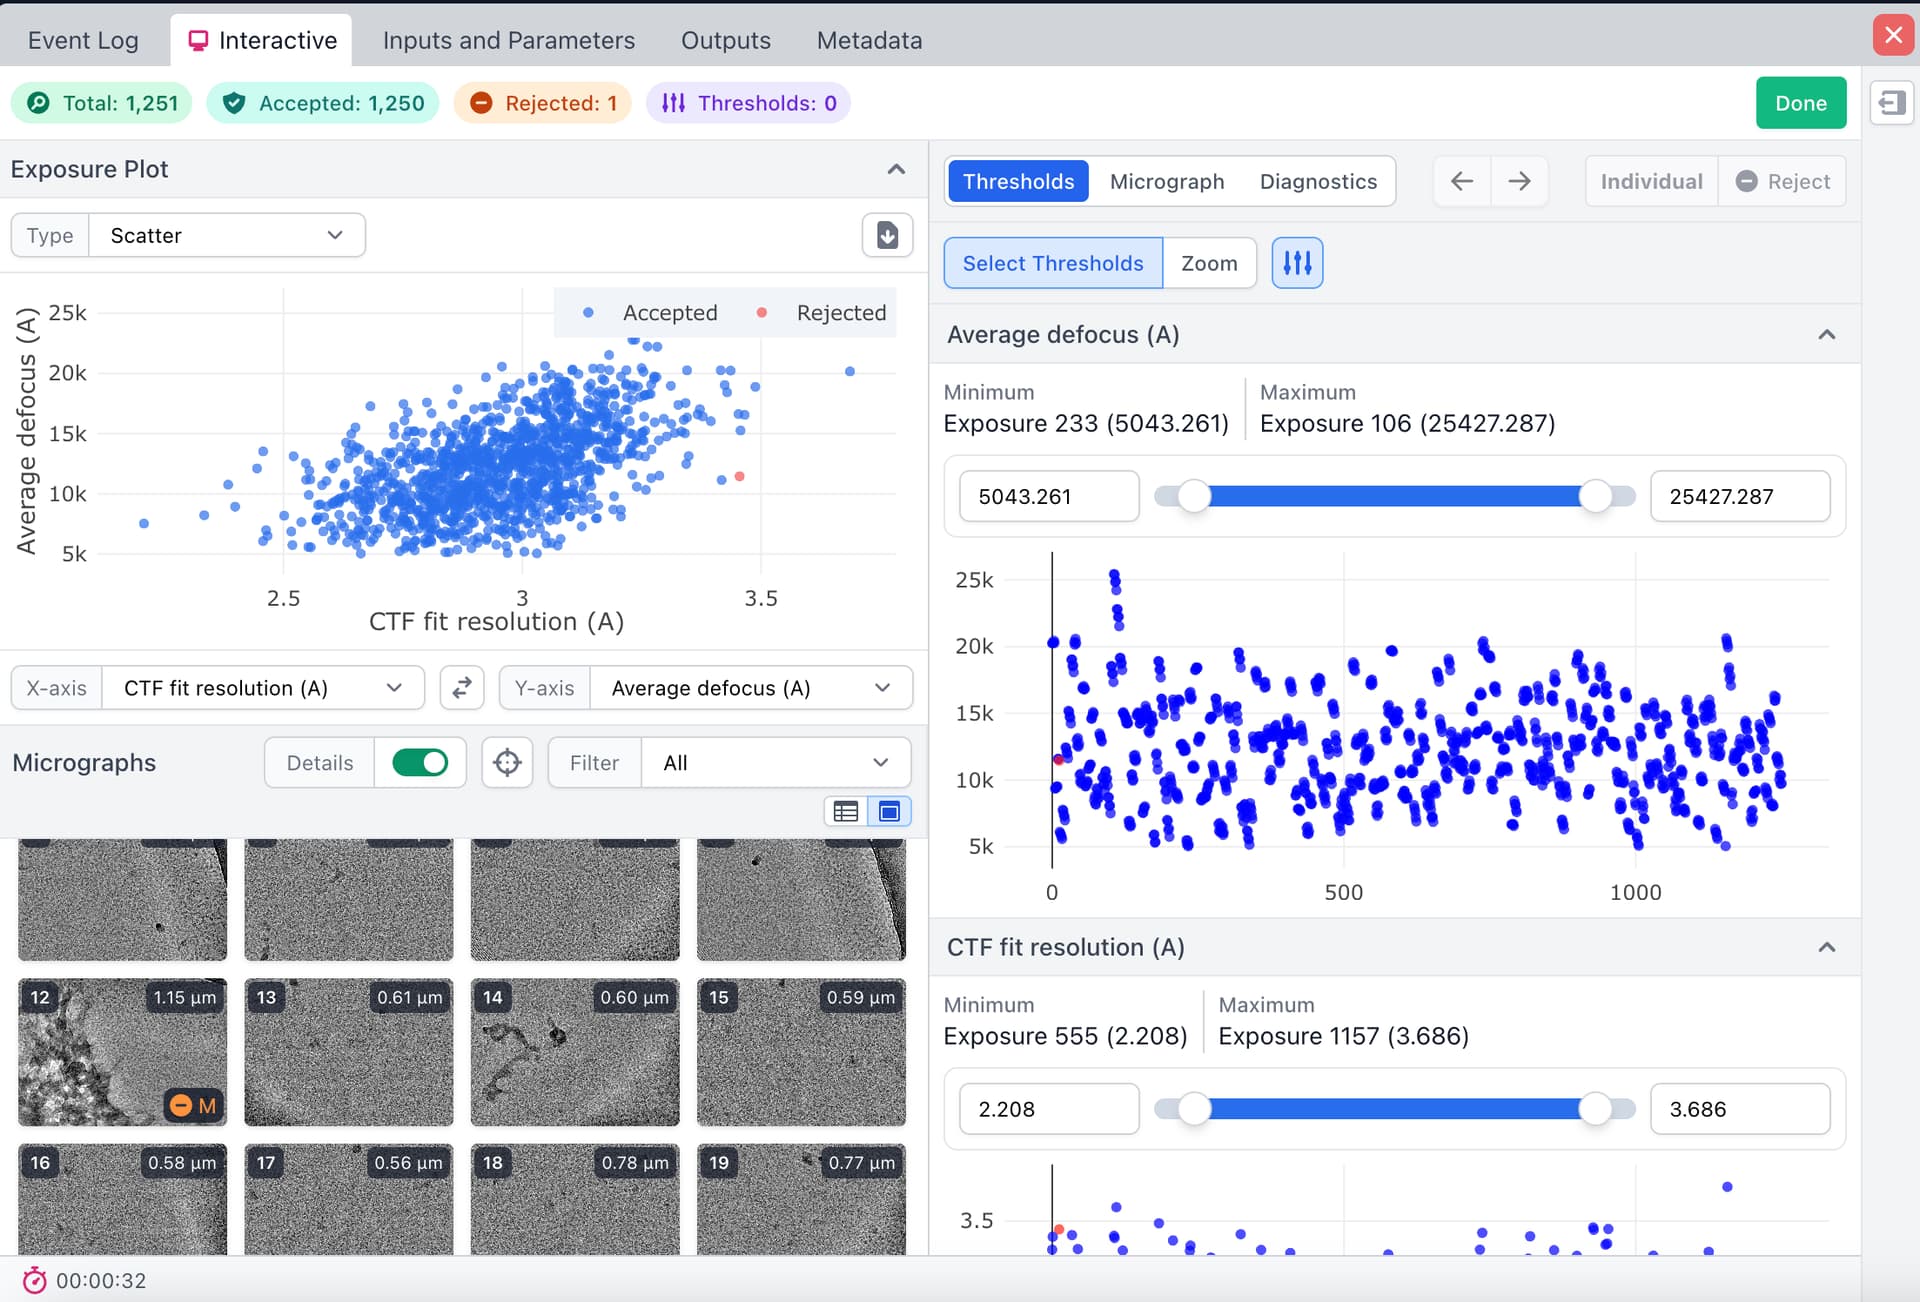
I would like to be able to maximize the “cards” view of the micrographs, to more easily manually reject outliers (being able to adjust the size of the thumbnails would also be fantastic, as would showing the denoised versions, if available!)
These are great suggestions - we’ve noted them down for the future! In the meantime, you may find it helpful to increase the number of bins and drag horizontally to zoom into a particular CTF range: