Hello guys,
I have been working on some amyloid fibrils for the past weeks and I have come to a point where I don’t know how to proceed. For starters, I’m not sure about the process of optimizing, or finding ‘the right’ helical parameters.
The literature reports a very conserved helical rise of 4.75 A within the fibrils, as this is the characteristic cross-beta spacing. So for this parameter I put in 4.75 A as the estimated value and then for the Minimum/Maximum helical rise to search over I put in 4.5 A, and 4.9 A, respectively.
For the helical twist it’s not that straight-forward unfortunately, as it is polymorph-specific and depends on the cross-over (or half-turn) distance that the fibrils exhibit, and my fibrils show a wide range of cross-over distances. I took the mean value of the fibril measurements I did, and from that I got an estimated twist of -0.57 (literature reports left-handedness for in-vitro fibrils, hence the minus). I decided to take the standard deviation of my measurements to calculate my twist margins and these I put in as the Minimum/Maximum helical twist to search over, namely -0.70 and -0.48.
Here’s the helical symmetry error plot i got from my last helical refinement job using these parameters:
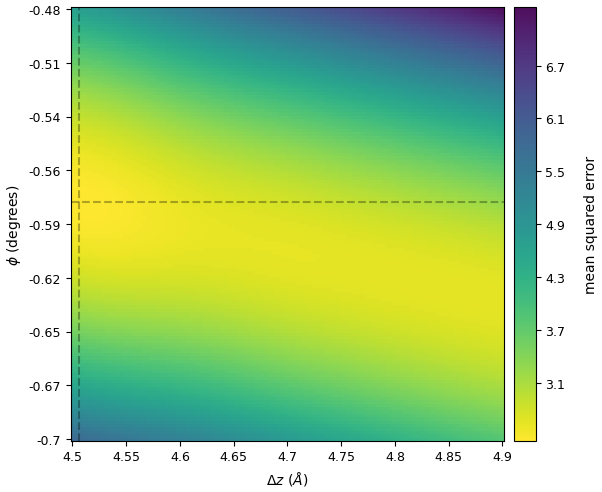
Whatever I do, I can’t get a plot where there is an unambiguous optimal combination of twist and rise, as you have shown in a thread about this topic.
And here’s a plot from a different helical refinement in the same dataset, where I used slightly broader rangers for the rise/twist search:
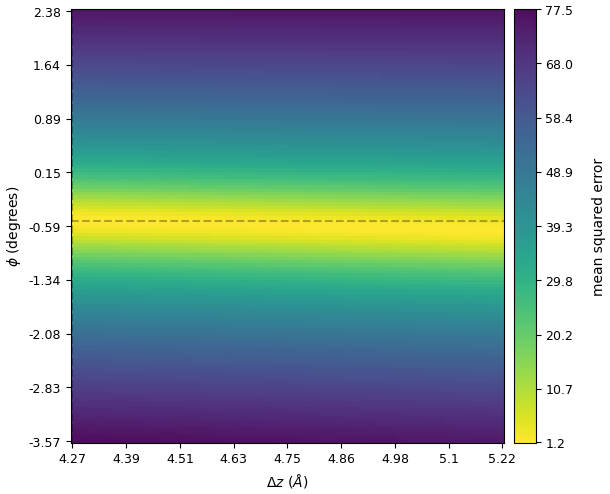
I don’t know if this means that I am very off from the actual parameters, or it is an effect from the apparent heterogeneity I see in the fibrils.
Just a quick note - I suspect that there are multiple different polymorphs in my dataset that resemble eachother, and I managed to filter the particles using a lot of iterations of 3D classification, so the job where the first plot is from should contain (presumably) a clean set of particles. It still shows a lot of possible combinations of twist and rise however, so this is very confusing to me.
How do I interpret these plots?
And to finish off I have a general question on how to increase resolution of helical structures, as I currently stand at just below 4 A, which is still far from Nyquist. Here are some things I have tried - a couple of different extraction box sizes, a lot of Homo Refinements and Helical Refinements with different parameters, a bunch of 3D classification jobs to filter particles, and a lot of going back and forth between these steps.
Do you have any specific tips when it comes to the final stages of refinement of a helical structure?
I’d be grateful for all kinds of ideas and suggestions!
Best,
Kristina