Hi,
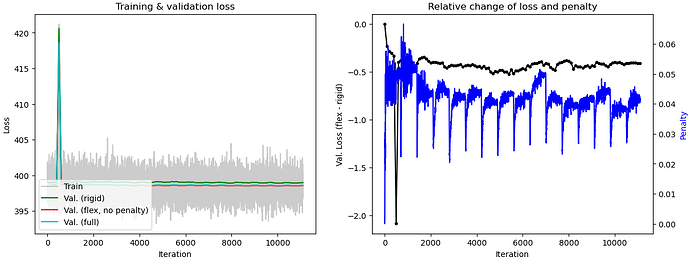
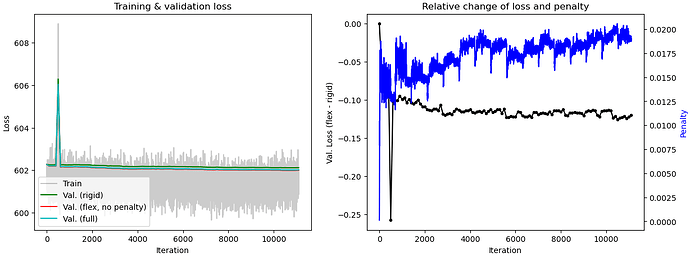
I’ve been playing around with a dataset that has significant flexibility around a homodimerization domain and one of the things I wanted to try was 3D flexible refinement. I’ve generally followed the steps outlined in the recent end-to-end processing guide but when I run 3D flex training, things get weird around iteration 500 (see representative example below) and don’t recover for the remainder of the training.
My dataset is pretty well-pruned via a few rounds of iterative heterogeneous refinement and I’m pretty confident that I set up the mesh and data prep jobs correctly. Is this blip in the plot representative of something wonky, and if so is there a way to correct for this?

