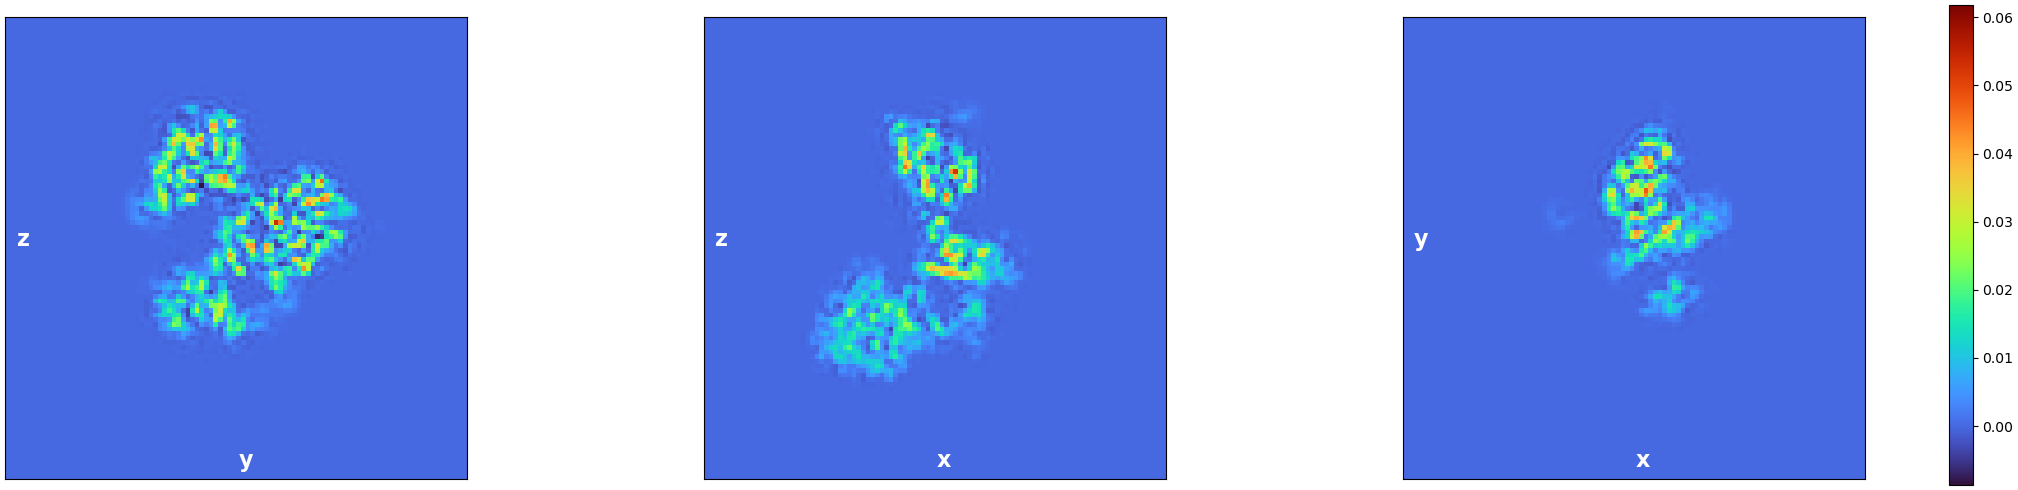
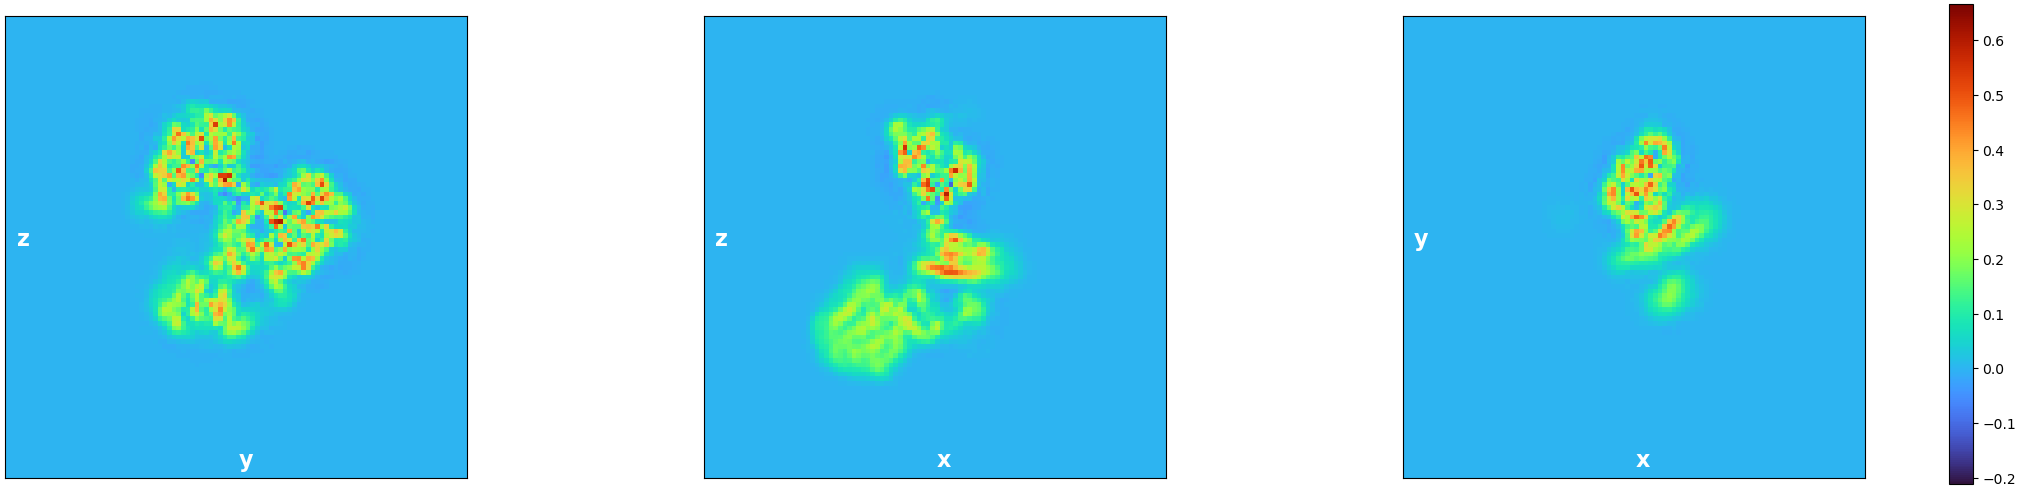
I’m getting odd looking change of loss/penalty curves that have a sudden dip early on during 3D flex training followed by an extend flat when trying to improve the density for a flexible domain in my structure. This domain is internally rigid and using local refinement with appropriate masking I can get better than 3A resolution in that region. Has anyone seen this issue before or is there an obvious solution? I’m attaching relevant images from the run here. I’ve set a box size with a Nyquist resolution of 5.4A during flex data prep step.
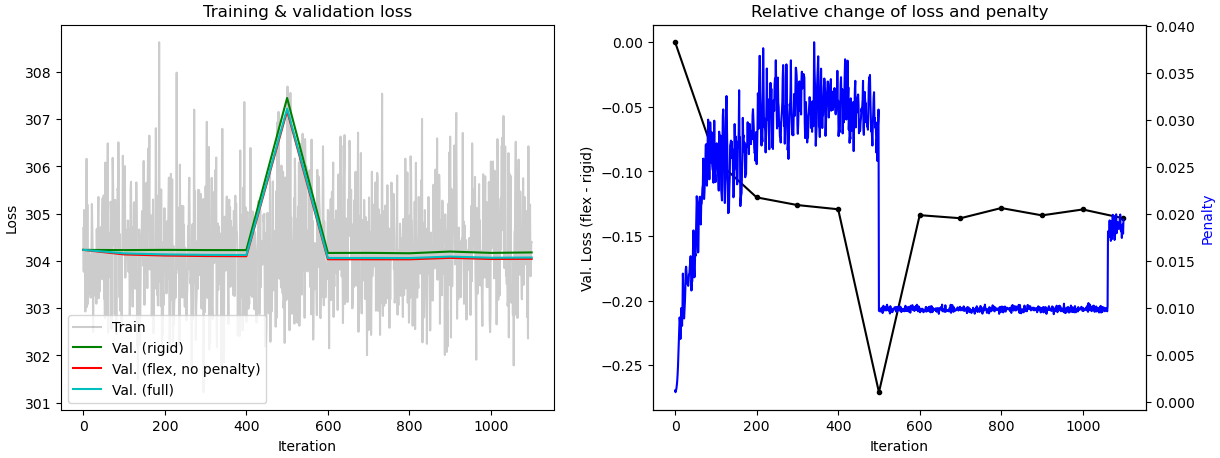
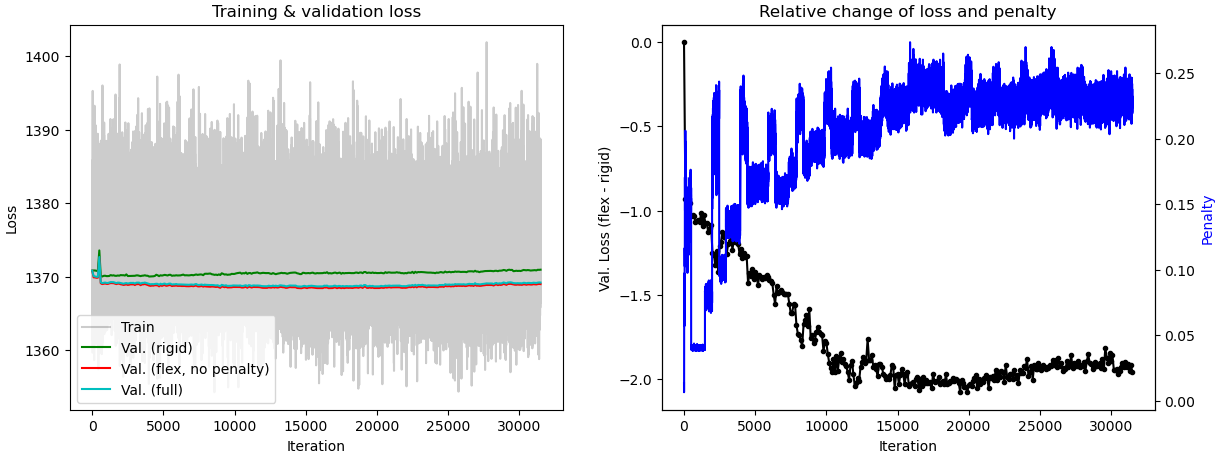
Hi @jcheung! The penalty curve shape you describe is expected. The Flex Training job alternates between updating the latent space and updating particle coordinates in the latent space. The penalty will be different during these two modes, so you see these differences in the plot as the training switches. For comparison, here’s a completed 3D Flex Training job’s Loss/Penalty plot where the alternation between the two modes is quite striking:
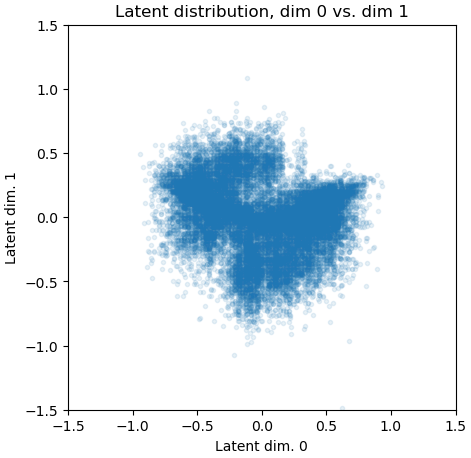
Since you’ve only completed a relatively small number of iterations it’s too early to tell for sure, but your latent centering strength may be too high (particles are not extending all the way to +/- 1.5 in latent space). You may be interested in other posts on the topic of 3D Flex Training.