Dear all,
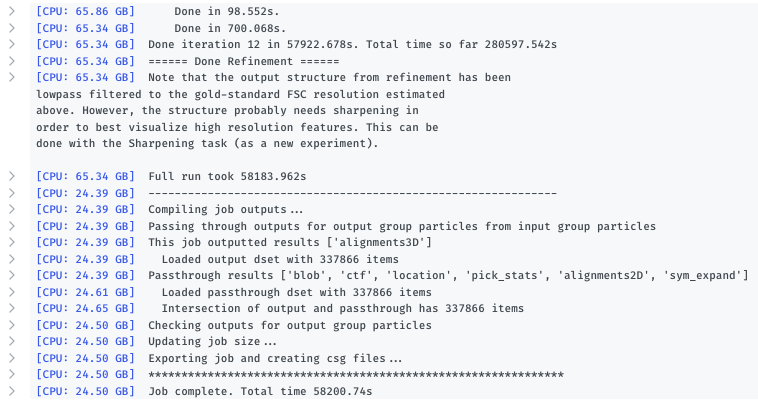
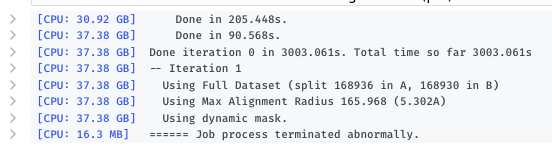
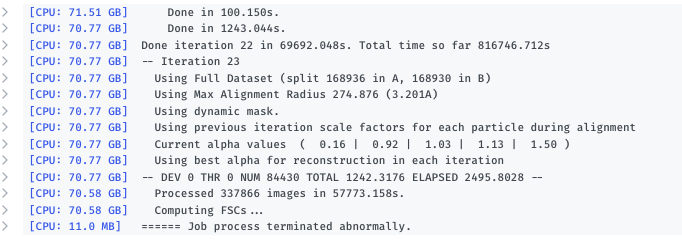
I’m observing odd behaviour in a series of local refinement (legacy) jobs I’m running after symmetry expansion. I’m trying different masks on parts of a protein complex and while one mask/job runs perfectly fine and converges after iteration 12, two others fail after iteration 1 and another one after iteration 23.
This one works:
These don’t:
I prepare the masks according to the instruction on the blog, using segmentation in chimera and treat them all the same in terms of dilation/softening. The only difference is (should be) that they cover different parts of the protein complex, but are very close to each other (in fact, the different masks overlap slightly). All other inputs are the same. Since there is no “real” error, I can only guess why they fail, I have someone from our cluster investigate the cluster side of it. We are currently running CS v3.1.0.
Could it be that some masks/subvolumes are computationally more expensive and the job runs out of memory? (I think this is happening for us at the moment with new local refinement). But there is also this sudden jump in what it shows as CPU memory? … Should I play around with masking? Dynamic vs static mask?
This is our submission script:
#!/bin/bash
#PBS -N cryosparc_P24_J608
#PBS -l nodes=1:ppn=4:gpus=1:shared
#PBS -l mem=96000mb
#PBS -l walltime=168:00:00
#PBS -o /home/projects/cpr_sbmm/people/clakie/cryoSPARC/P24/J608
#PBS -e /home/projects/cpr_sbmm/people/clakie/cryoSPARC/P24/J608
available_devs=""
for devidx in $(seq 0 15);
do
if [[ -z $(nvidia-smi -i $devidx --query-compute-apps=pid --format=csv,noheader) ]] ; then
if [[ -z “$available_devs” ]] ; then
available_devs=$devidx
else
available_devs=$available_devs,$devidx
fi
fi
done
/home/people/cryosparc/software/cryosparc/cryosparc2_worker/bin/cryosparcw run --project P24 --job J608 --master_hostname g-05-c0351.cm.cluster --master_command_core_port 39002 > /home/projects/cpr_sbmm/people/clakie/cryoSPARC/P24/J608/job.log 2>&1
Any help and hints are much appreciated!!
Best,
Claudia