Hello, I have two questions regarding the 3d-flex:
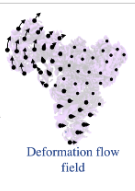
In terms of result representation, How could I plot the deformation flow field as shown in the tutorial?
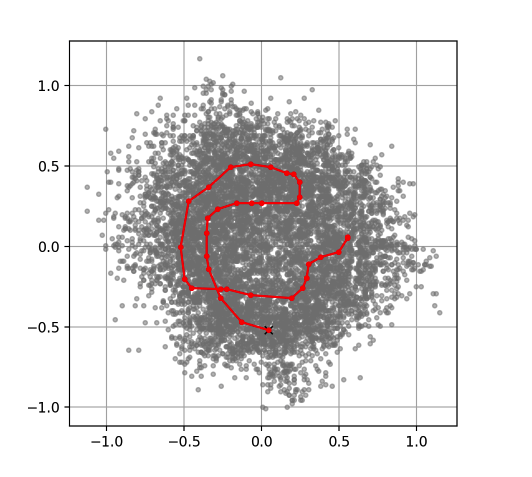
For the customer latent trajectory, is there a criteria how I should trace the plots? It seems in the tutorial it is quite arbitrary, whereas in the default setting it is simply the vertical axises?
Hi @nym2834610! We’re glad you’re finding 3D Flex useful!
For your first question, that plot is created manually. We do not know of a good way to generate such plots algorithmically. For instance, the curved arrows shown are meant to indicate a rotational movement, which would depend on the trajectory through the latent space (as you hint at in your second question), and there’s no way to know the optimal trajectory without manual inspection.
If you require a 2D summary of the results, the best method is probably to inspect the volume series and manually construct a figure that you feel best summarizes the movement.
Similarly, for your second question, there’s probably not a “best” way to display or inspect these latent spaces. Their non-linear nature (summarized here) makes it challenging to find a best path. I would guess that manual inspection of several trajectories would be necessary to find the most informative path.
I am sorry to not have the plot generation methods you were hoping for, but I hope that is helpful nonetheless!
What I meant is actually how I could plot the same picture in figure 1 since this is presented in the nature protocol paper by cryosparc team. I assume there is a way I could get these deformation flow value corresponding to my volumes?
The image from the paper, the one you copied, was produced manually. Since the deformation flow field depends on the slice of the volume you present, as well as the trajectory through latent space that you take, there is not a way to produce a similar figure using the data alone. It will require manual creation.
Consider that the curved arrows in the plot you showed represent a particular path through the latent space — any given coordinate does not model a curved path. We display the curved arrows because some of the principle motion represents rotation of this domain, which we chose to represent this way. But there is nothing in the data lone that would tell us to use curved arrows, or where they should point, etc.
In other words, we made this figure by hand to show the motion we observed in a particular region of latent space. We observed this motion by manually inspecting the 3D Volume series generated from a path through the latent space.