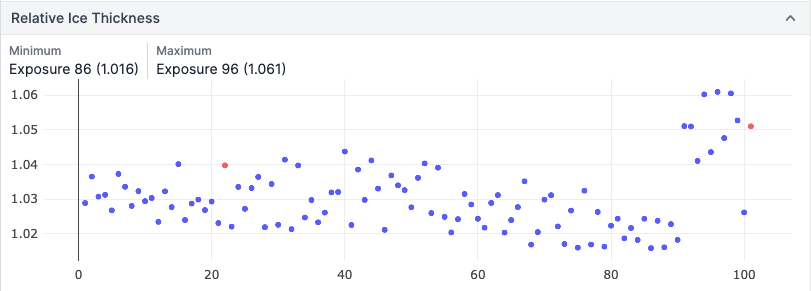
I’ve been using CryoSPARC live without issues. However, after the last update to Cryosparc, whenever I click on the “Relative Ice thickness” option in “overview”, the window freezes and I have to reload the page because the GUI stops working. Looks like a bug that didn’t happen before.
If you encounter this error again, before reloading the page please open the browser console (right click in anywhere in the UI, ‘Inspect Element’, click on the ‘Console’ tab) and paste any error message you see.
I’ve seen the same issue at least twice on our setup. It’s working as expected initally, but after some time when returning to Ice Thickness the browser tab freezes and I have to reload. If I recall correctly, some NaN values are reported - maybe instead of the set thresholds. I just checked the last dataset affected, but it seems the issue is gone again after the session was completed.
Is there anything I could check next time it happens that might help you track this minor issue down?
Thanks for the additional information! If you run into this issue again, before reloading the page please open the browser console (right click in anywhere in the UI, ‘Inspect Element’, click on the ‘Console’ tab) and paste any error message you see. That should help us determine the cause - as you suspect it could be an invalid value that is preventing the graph from re-rendering.
Uncaught (in promise) Error: noUiSlider (14.6.3): 'range' value isn't numeric.
    U /node_modules/nouislider/distribute/nouislider.js:3
    V /node_modules/nouislider/distribute/nouislider.js:3
    F /node_modules/nouislider/distribute/nouislider.js:3
    nt /node_modules/nouislider/distribute/nouislider.js:3
    nt /node_modules/nouislider/distribute/nouislider.js:3
    ot /node_modules/nouislider/distribute/nouislider.js:3
    j /client/containers/_live/_overview/ThresholdControls.svelte:1
    l http://[server]:39006/e46087a5cea0470bfe33c956a8e24333c6d22c58.js?meteor_js_resource=true:7
    Kt http://[server]:39006/e46087a5cea0470bfe33c956a8e24333c6d22c58.js?meteor_js_resource=true:7
    ot http://[server]:39006/e46087a5cea0470bfe33c956a8e24333c6d22c58.js?meteor_js_resource=true:7
    bindEnvironment http://[server]:39006/e46087a5cea0470bfe33c956a8e24333c6d22c58.js?meteor_js_resource=true:1
This was running in Firefox and was working fine for first many hours.
I don’t have Chrome on this computer right now, but got more or less the same error in the latest version of Edge (90):
Uncaught (in promise) Error: noUiSlider (14.6.3): 'range' value isn't numeric.
    at U (/node_modules/nouislider/distribute/nouislider.js:3)
    at new V (/node_modules/nouislider/distribute/nouislider.js:3)
    at Object.F [as t] (/node_modules/nouislider/distribute/nouislider.js:3)
    at eval (/node_modules/nouislider/distribute/nouislider.js:3)
    at Array.forEach (<anonymous>)
    at nt (/node_modules/nouislider/distribute/nouislider.js:3)
    at Object.ot [as create] (/node_modules/nouislider/distribute/nouislider.js:3)
    at eval (/client/containers/_live/_overview/ThresholdControls.svelte:1)
    at l (e46087a5cea0470bfe33c956a8e24333c6d22c58.js?meteor_js_resource=true:7)
    at Array.map (<anonymous>)
It’s been a while but I have an update I hope will help you track this down.
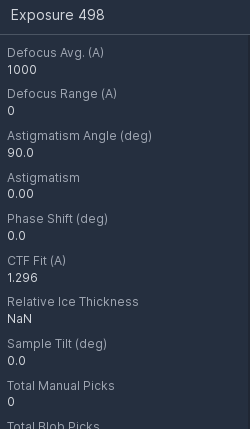
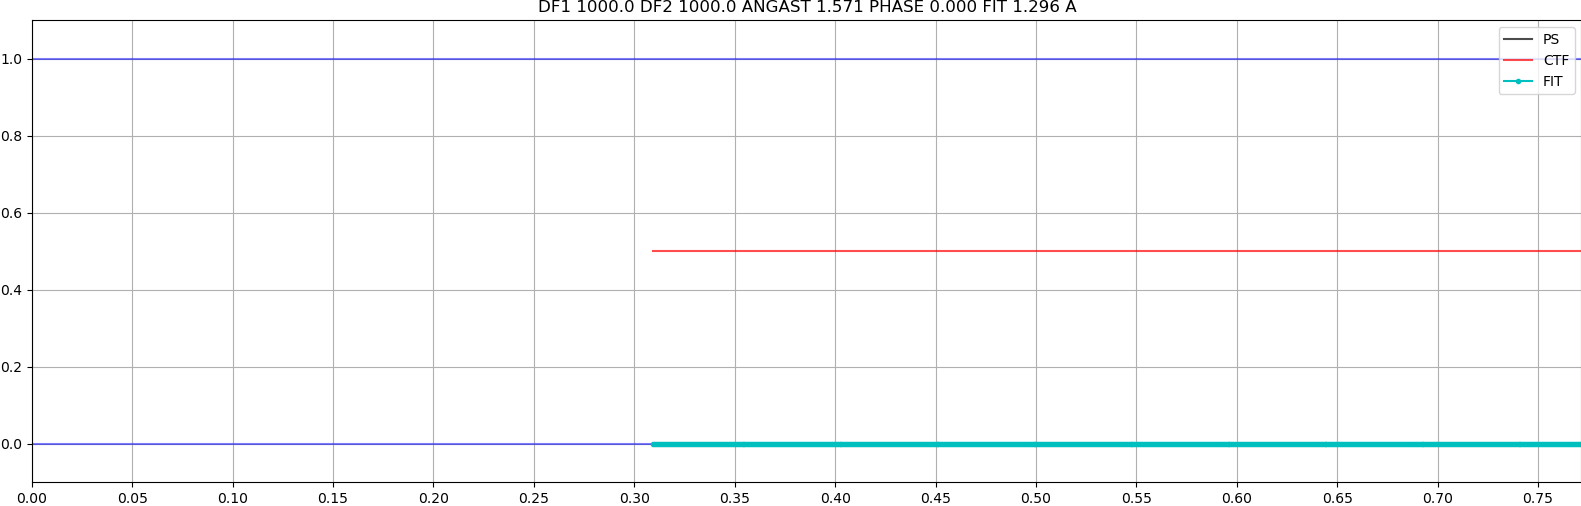
We hit the issue again last week, but this time I found a specific movie that I suspect is the cause. This (very poor quality) movie evaluates to an ice thickness of NaN when checking the stats from the Live interface:
which doesn’t look great for estimating a ratio - divide by zero error?
So I guess the reason we previously only saw this after the session had been running for a while was just that it needed a bad enough movie to enter the processing.
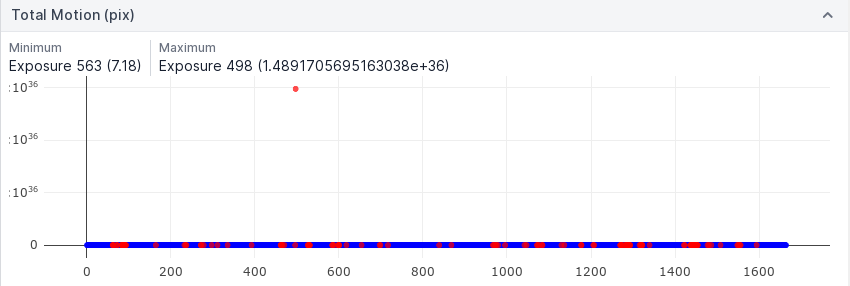
Another problem caused by this movie is that the motion estimates are extreme:
Total Motion (pix): 1.4891705695163038e+36
Max In-Frame Motion: 9.596886779369273e+34
causing the scale in Overview for those parameters to become useless, as it would take “forever” to zoom in to see the rest of the data:
Having some sanity check or reasonable max values on some of the parameters would be nice.
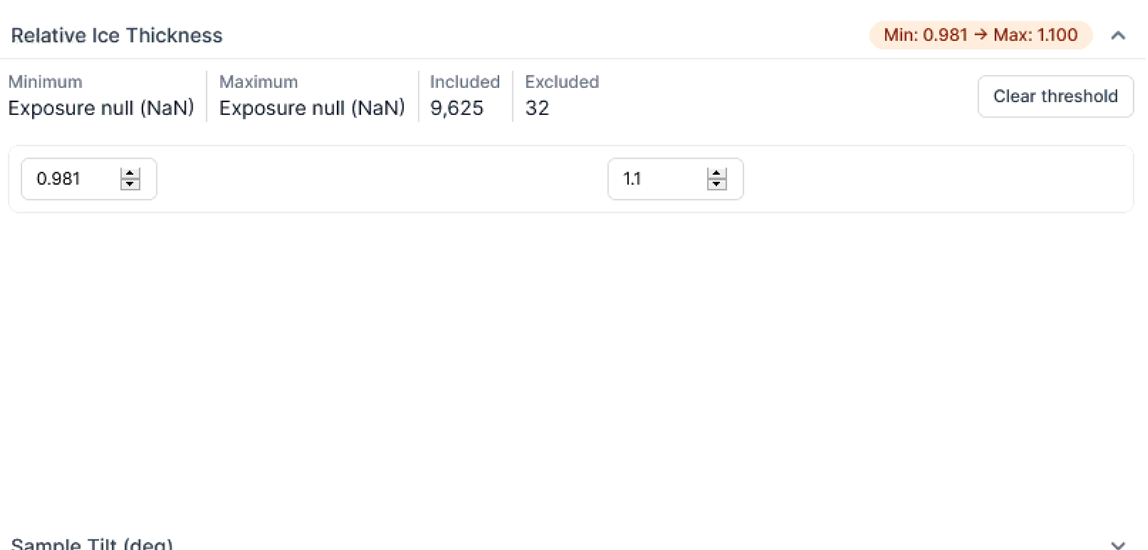
Along the same line, it would be nice with a bit more freedom in setting the thresholds in the Overview. For now, it seems to only allow values close to the values observed so far in the session, which often mean we can’t set good cut-offs until we see the first outliers in a running data collection.
Even better would be to have default values as part of our presets, so we could apply conservative cut-offs from the beginning (eg. defocus range 0-2000, total motion 0-40, astigmatism 0-1000, ice thickness 1.00-1.12 ect.).
Sorry for going a bit off-topic and into suggestions for usability improvements instead!
The relative ice thickness is computed from the statistics of the micrograph power spectrum, so it depends on many properties of the specific dataset, including dose, magnification, camera properties, and so on. It’s expected to change from one dataset to another. You can interpret the ice thickness value relative to other micrographs in the same dataset, or between datasets where the imaging setup is exactly the same.
Thank you Harris, your reply gives me a general conception of how relative ice thickness is caculated.
Since ice thickness plays a pivotal role in 3D reconstruction of particular protein samples which may pocess a preferiential orientation. And I wish some new scripts can help in the future.
Regards
-Soul
I’m interested to know what paper did you refer when calculating the “Rel Ice Thick”? I want to do some correlation calculation between my data quality and ice thickness.