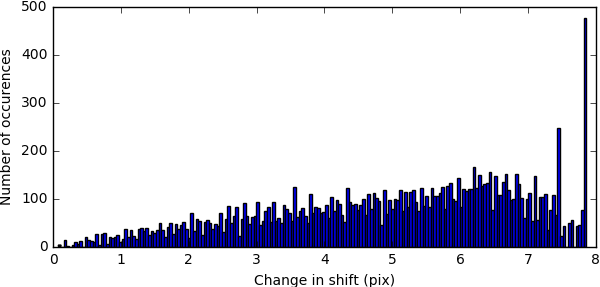
Hi. I’m wokring with the cs file of a local refinement job to separate particles based on how much they changed during local refinement. I assumed the shifts can be plotted with something like this
%local_shift= parent_3D_refine_job.data[‘alignments3D/shift’] - local_refine_job.data[‘alignments3D/shift of local refine job’]
plt.hist(n.reshape(abs(local_shift),-1),bins=150);
However, my histograms look different from the job output. The range of shifts is the same, but histogram peaks and heights are different. BTW, 2D shifts is zero in both jobs, so that shouldn’t contribute.
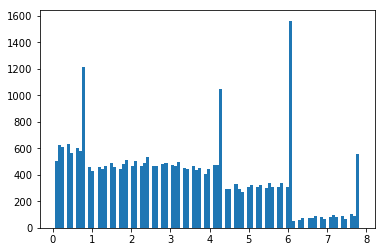
In the streamlog plots, the magnitudes of the shifts are calculated each iteration by taking the euclidean norm of the difference between the refined shifts and the initial shifts, rather than the absolute value of the x and y shifts individually. This should be mostly similar to what you’ve shown:
import numpy as n
from matplotlib import pyplot as plt

local_shift = local_refine_job.data[‘alignments3D/shift’]  - parent_3D_refine_job.data[‘alignments3D/shift’]
shift_magnitude = n.linalg.norm(local_shift, axis=1)

plt.hist(shift_magnitude, bins=200)
Let me know if this explains the discrepancy between the two.