Hey everyone, just following up on this since we are experiencing the same issue. We are on CryoSPARC v4.7.0, running the same way over NFS. Master server is running 4cpus, 32GB RAM. However, it seems to stem from the gunicorn process. We do keep the WebUI up at all times for our users and only restart when needed (update or to fix this issue)
top - 08:40:35 up 44 days, 10 min,  1 user,  load average: 0.00, 0.03, 0.02
Tasks: 246 total,   1 running, 245 sleeping,   0 stopped,   0 zombie
%Cpu(s):  0.0 us,  0.0 sy,  0.0 ni,100.0 id,  0.0 wa,  0.0 hi,  0.0 si,  0.0 st
MiB Mem :  31888.6 total,   1241.6 free,  11382.3 used,  19264.7 buff/cache
MiB Swap:   8076.0 total,   5186.1 free,   2889.9 used.  19548.9 avail Mem

    PID USER                PR  NI    VIRT    RES    SHR   SWAP S  %CPU  %MEM     TIME+ COMMAND
 581000 cryosparc  20   0   53400   8668   3044  11900 S   0.0   0.0   4:41.47 python /applications/cryosparc/cryosparc_master/deps/anaconda/envs/cryosparc_master_env/bin/supervisord -c /applications/cryosparc/cryosparc_master/supervisord.conf
 581116 cryosparc  20   0 6122264   4.0g   9924  23708 S   0.0  12.9 230:37.22 mongod --auth --dbpath /applications/cryosparc/cryosparc_database --port 39001 --oplogSize 64 --replSet meteor --wiredTigerCacheSizeGB 4 --bind_ip_all
 581226 cryosparc  20   0  106108  25136  15168  19128 S   0.0   0.1   2:05.46 python /applications/cryosparc/cryosparc_master/deps/anaconda/envs/cryosparc_master_env/bin/gunicorn -n command_core -b 0.0.0.0:39002 cryosparc_command.command_core:start() -c /applications/cryosparc/cryosparc_master/gunicorn.conf.py
 581227 cryosparc  20   0 5559772   2.8g  20468   1.9g S   0.0   9.1  97:28.16 python /applications/cryosparc/cryosparc_master/deps/anaconda/envs/cryosparc_master_env/bin/gunicorn -n command_core -b 0.0.0.0:39002 cryosparc_command.command_core:start() -c /applications/cryosparc/cryosparc_master/gunicorn.conf.py
 581255 cryosparc  20   0 1923084 272744  92408 239080 S   0.0   0.8  28:52.05 python3.10 /applications/cryosparc/cryosparc_master/deps/anaconda/envs/cryosparc_master_env/bin/flask --app cryosparc_command.command_vis run -h 0.0.0.0 -p 39003 --with-threads
 581257 cryosparc  20   0  106104  22164  15224  22512 S   0.0   0.1   2:02.65 python /applications/cryosparc/cryosparc_master/deps/anaconda/envs/cryosparc_master_env/bin/gunicorn cryosparc_command.command_rtp:start() -n command_rtp -b 0.0.0.0:39005 -c /applications/cryosparc/cryosparc_master/gunicorn.conf.py
 581259 cryosparc  20   0 1153312 160928  81744  68452 S   0.0   0.5  92:19.36 python /applications/cryosparc/cryosparc_master/deps/anaconda/envs/cryosparc_master_env/bin/gunicorn cryosparc_command.command_rtp:start() -n command_rtp -b 0.0.0.0:39005 -c /applications/cryosparc/cryosparc_master/gunicorn.conf.py
 581286 cryosparc  20   0 1038396 135716  18520  10548 S   0.0   0.4  18:31.79 node dist/server/index.js
 581411 cryosparc  20   0 2071580 998.9m  14760  13380 S   0.0   3.1 142:13.34 /applications/cryosparc/cryosparc_master/cryosparc_app/nodejs/bin/node ./bundle/main.js
A simple cryosparcm stop and cryosparcm start seems to resolve the issue for a time period, but the memory usage continues to climb afterwards.
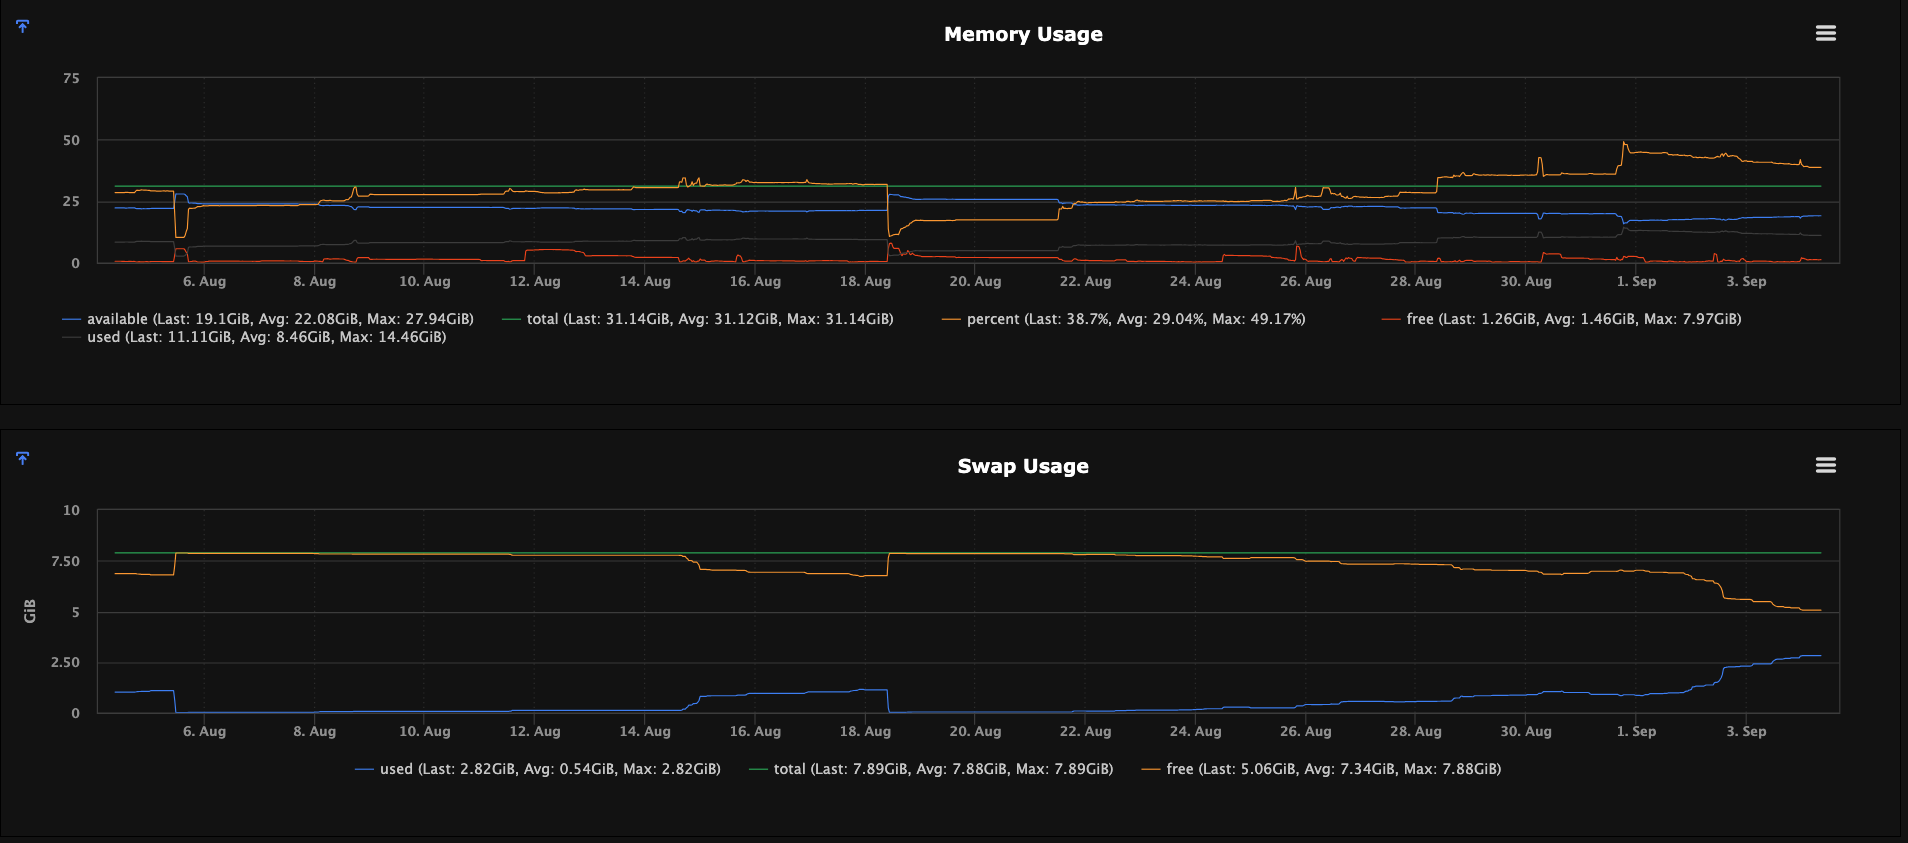
Any ideas on what could be causing this memory leak and is there any planned patch for this?