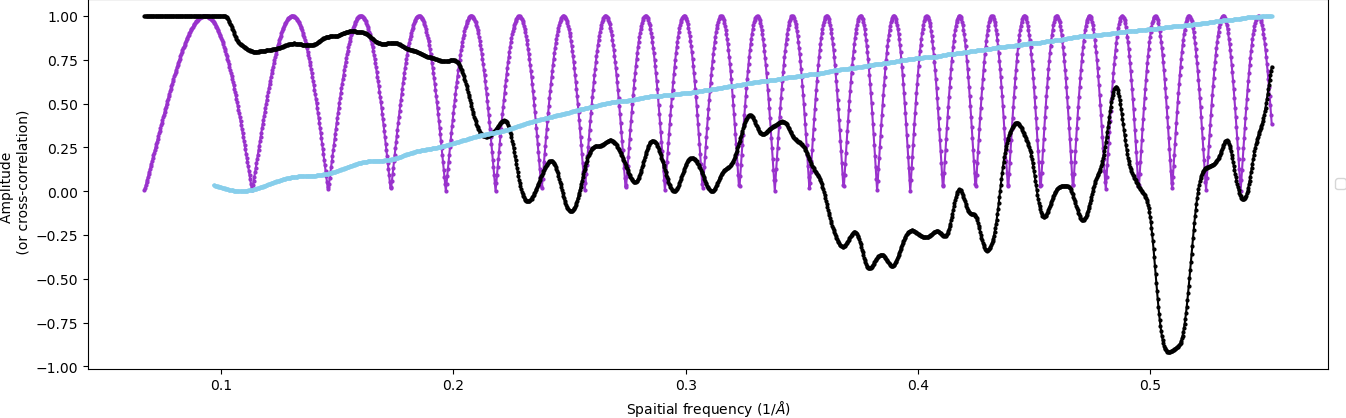
Hi! I was wondering what each colored line means in the 1D diagnostic plot of Gctf (both in the log of the run and when curating the exposures). I show one example of this plot below:
Thank you!