But how can one calculate the resolution of this curve at the FSC=0.143 criterion?
In the other words - at what resolution does the FSC phase randomized masked map plot crosses the FSC=0.143 criterion? (where can we see that in the FSC txt file)
Hi Dmitry, you should be able to see this if you look at the raw data I think, but I’m not sure it’s all that informative - you expect the phase-randomized curve to fall off very rapidly after the resolution at which phases are randomized, so I’m not sure how meaningful the resolution value of this curve will be. It is useful to show in the context of the corrected curve to give some sense for the effects of correlations introduced by masking, but beyond that I wouldn’t personally worry about the GS resolution value
Hello @olibclarke . Thank you for your answer! I was not worried about this “beautiful curve” until the reviewer specifically asked for it
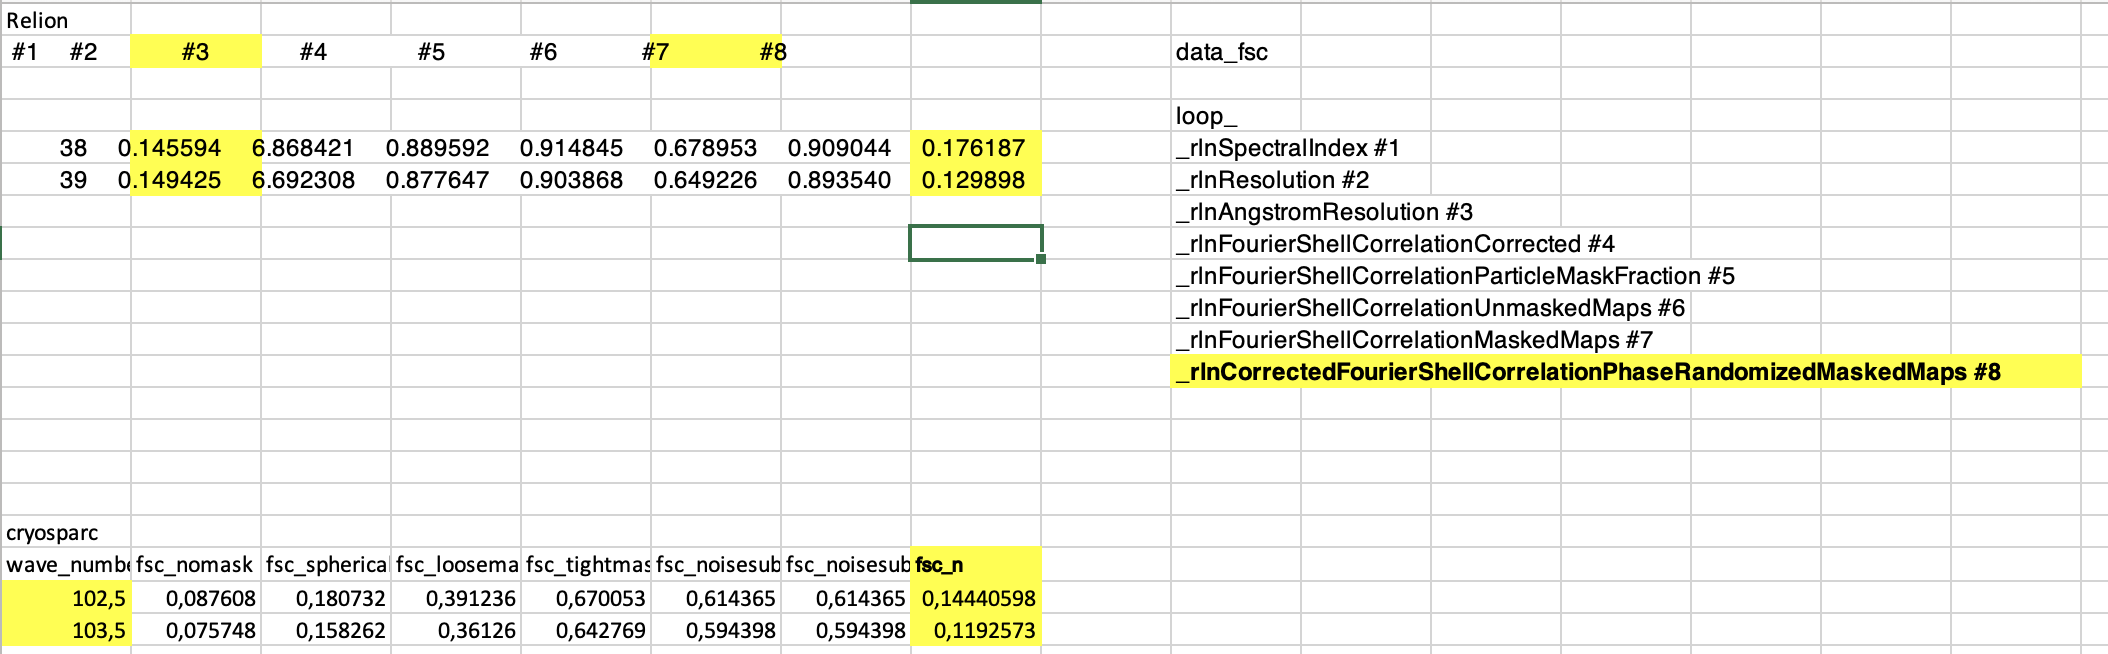
Do you by chance know where to find the #resolution column in fsc.txt (as the one present in relion - _rlnAngstromResolution #3)? I see only wave_number fsc_nomask fsc_sphericalmask fsc_loosemask fsc_tightmask fsc_noisesub_true fsc_noisesub
Because as we know in Relion the resolution of the FSC phase randomized masked map plot we can find out by seeing where the FSC of this plot dropped below 0.143
But in cryosparc I am a little confused when applying a similar approach. Because it seems that I have to divide 1/102.5 (or103.5).
My FSC wavenumber starts from 0.5 and finishes on 189.5
In order to convert the wavenumber values (units of voxel indices) to frequency (in 1/Å), you’re correct that you must divide the wavenumber by a conversion factor:
frequency = wavenumber / (N*pixel_size)
where N is the box size of the reconstruction. This will convert the wavenumber values to frequency values for plotting along the x-axis of an FSC plot.