Hi All,
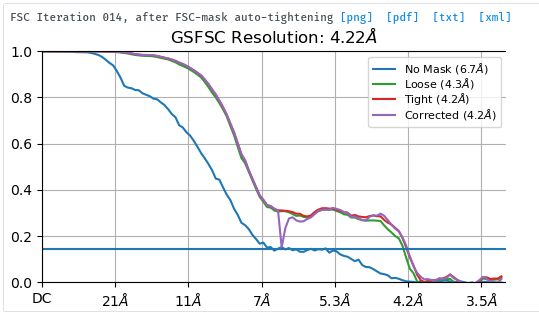
We have a structure at 4.8A resolution and trying to improve the resolution and map through local refinement with a mask. The overall protein complex is a dimer with 200kDa molecular weight. Particle subtraction followed by local refinement does not lead to an increase in the map or resolution, but local refinement with mask (positive mask excluding the flexible region) results in improvement of both the map quality and resolution. Please refer to the FSC below where we cannot see a smooth transition from 1 to 0. The FSC comes down smoothly till 7A, but follows a horizontal pattern till 4.5A before touching 0. The map actually looks like a 4.2A map. What might be the probable issue?