Hi all,
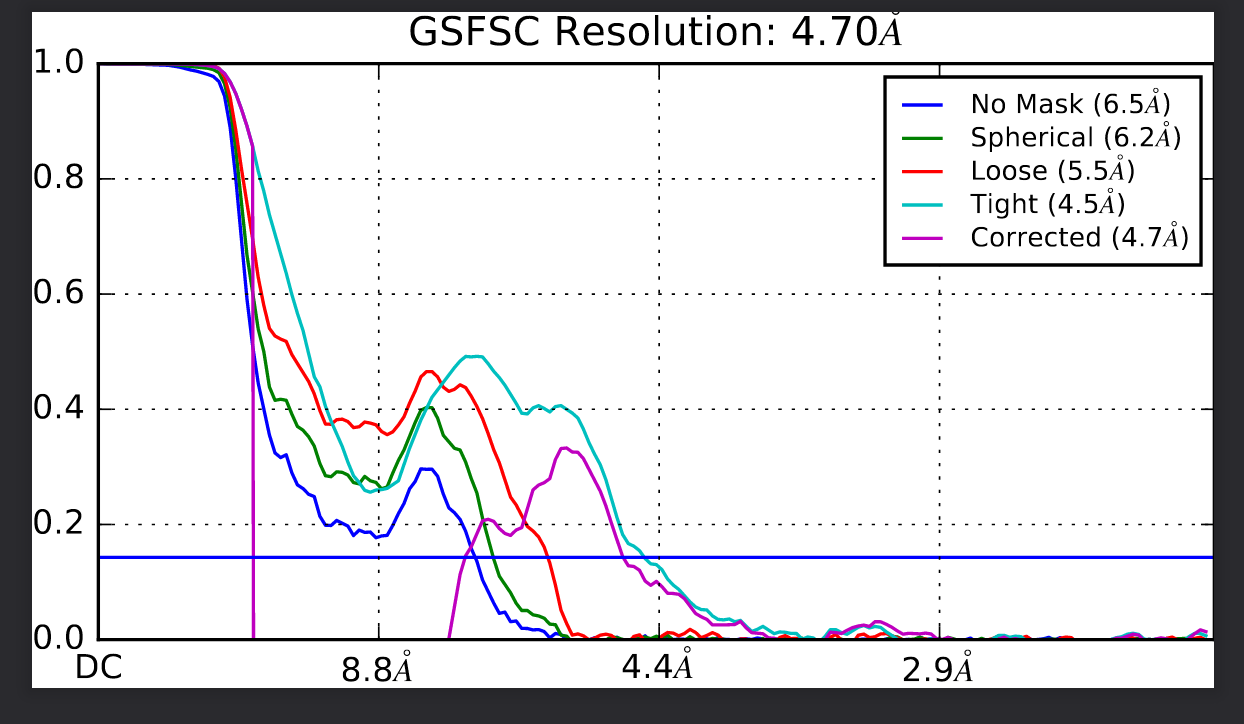
Can some one please explain me why I have such uneven dips and peaks in my FSC curve.
The map does not look like 4.7. I found a similar question on board in the past, suggesting changing the
near and far parameters in units of A , that control the mask tightness. Could some one shed more light on what values I should try and why ?
Thanks
Which job type was this, and which version of cryoSPARC?
The dip in the FSC curve can be a result of dynamic masking, especially if the structure is not resolving to a medium/high resolution. As you mentioned, you can increase the dynamic masking near and far parameters to make sure that the mask is not sharper than the resolution of the map.
So if this is due to dynamic masking, do you suggest using a supplied mask and keep the threshold for applying dynamic mask very low like 4A .
You suggesting increasing the near and far parameter, could you elaobrate what is this near and far means.
Thanks
Man
I am observing a similar thing with my dataset (FSC curve from a map obtained from homogenous refinement). I took the set of particles and passed it through one (or two) rounds of heterogenous refinement and with the smaller set of particles when I did homogenous refinement, the FSC curve looks more reasonable - the huge dip goes down by a lot. I am assuming that the set of particles I was using earlier is a mix of good/bag particles but I don’t know what exactly is bad about them. The 2D class averages of the bigger set of particles look just as “good” as the 2D class averages of the smaller set - so I am not really sure what is bad about the particles and why they are screwing up the FSC curve. (I don’t know if something was suboptimal in the pre-processing steps).