Hi,
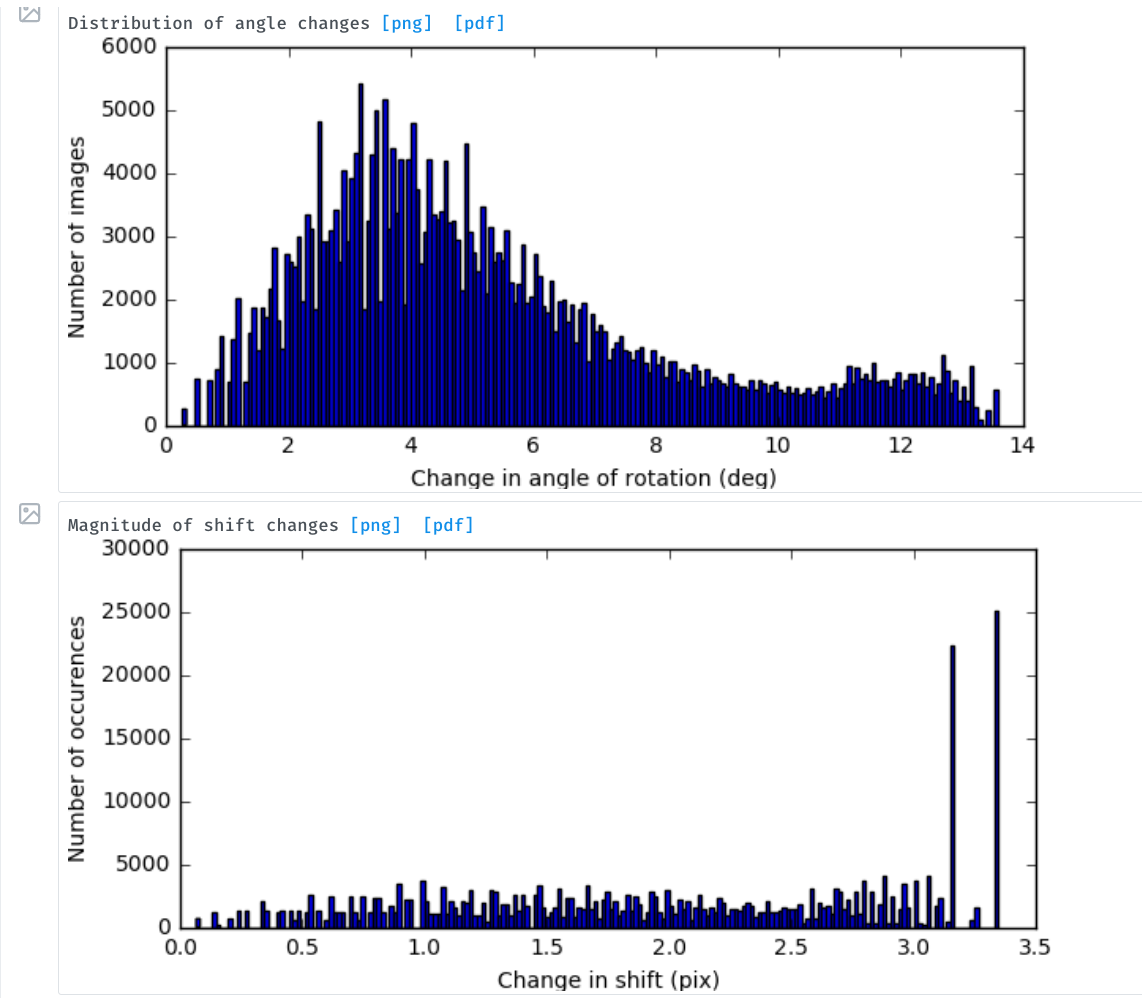
In local refinement, a plot is shown with angle and shift changes. I assume this is overall, although it isn’t stated anywhere that I can see.
I think it would be more useful to show the per-iteration values - how much have the orientations changed since the previous cycle. This would be more useful, I think, for monitoring convergence.
Cheers
Oli
Also - I’d love to know more details about what is going on here. for example, is the search range the range around the new value at each iteration? or is it constrained around the original value? I had assumed that it was the former, but it seems like after the first iteration, the max/min change in angle/shift doesn’t change very much, even if I set the search range to a smaller value than the required reorientation. Knowing this would be helpful in selecting values for the search range parameters.
Cheers
Oli