When dealing with samples that are a mixture of species - e.g. native lysates, or mixtures of oligomeric states - one of the tricky parts in the early stages of processing is identifying which classes correspond to which species, as it is often necessary to select subsets of 2D classes ~corresponding to single species in order to obtain well behaved ab initio models.
It occurs to me that looking at 2D classes, one can visually appreciate differences in molecular weight. Computationally, if one integrates intensity over the area within each class enclosed by a given threshold (e.g. 10% of max), presumably this value ought to be similar for classes corresponding to the same species in different orientations. Would it be possible to estimate the relative molecular weight, and use this to sort 2D classes for subset selection?
I know we have reference based 2D selection now, but that only helps once you have a 3D volume that you are confident about - often not the case for heterogeneous samples in the early stages of processing.
You would most likely want to do this using a concatenated numpy array of all of the images, so that your percentile is selected across the entire range of 2D class averages.
Set pixels below the threshold to zero, e.g., image[image < threshold] = 0
Optional: Consider whether you might want to use the convex hull of the pixels above your threshold? Not sure myself, whether or not this makes sense probably depends on particle topology and class average resolution?
Sum pixel values using np.sum()
Find class indices which have your desired total intensity
Filter the input particles by class membership (or maybe using a similar procedure to Class Probability Filter) using, e.g., particles.query({"alignments2D/class": list_of_good_classes}) and export using project.save_external_result()
A few notes you’ve likely already considered yourself:
2D Class averages are not re-normalized — they are straightforward averages of their component particles, so you most likely can compare intensity across 2D class averages
Datasets have different greyscales so the relative intensity is most likely not comparable across datasets
Depending on your choice of threshold, it’s possible that different views of the same particle will have different integrated intensities. For example, if you set a threshold which excludes pixels below the 5th percentile, a side view of an oblong target might lose a few pixels on the edges if they’re faint. These particles might be included in the view along the major axis, since they’d be brighter in that orientation.
Thanks Rich - I have a good test case for this, will try to mock something up and give it a go! Will the background intensity (below the threshold) vary with ice thickness? Or is that already normalized to go to zero at the edge?
Ah, are you you saying it may not always be wise to replace the pixels below the threshold with 0? That’s a good point!
Sorry to think out loud here, but I think we’re somewhat in uncharted territory so I’d like to show my work. The summary is I still think I’d use 0, but it may actually be good to try not thresholding at all as well.
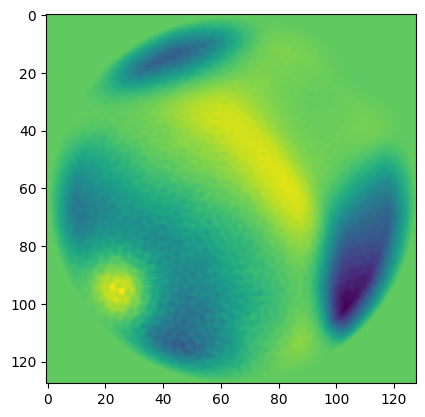
In 2D class averages, I typically observe the following structure (ignoring the zeros from the circular mask)
Positive values where the particle is
Negative values just next to the particle (I’d guess due to exclusion of neighboring particles, on average)
varying positive values near the edge of the circular mask (likely due to neighboring particles)
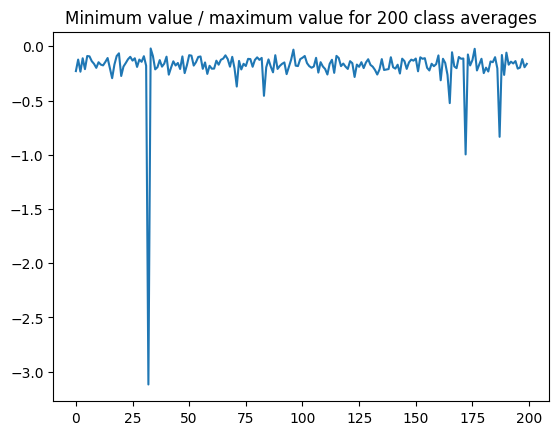
So it might make sense to “float” everything such that 0 is the minimum. However, in general the minimum value is quite small compared to the maximum:
(the spike is class 32, which is obviously bad)
On the other hand, you’d probably want to apply the same shift to all images so that you could still directly compare them. Moreover, you’re probably going to select a threshold such that all of these edge effects are excluded, which means they and everything below them (which would include the originally-negative pixels) will be set to the same value anyway. So I think I’d still pick a value of 0 for the thresholded pixels.
However, while thinking through this, I realized something that might present some difficulty here: a good class average integrated in this way will most likely end up with a higher value than a class average with a similar proportion of good particles, but poorer alignments, due to thresholding.
When you exclude low-value pixels, you may be excluding blurred out domains or misaligned particles in addition to excluding noise. So it may be best to try including all pixels, perhaps with a slightly tighter circular mask of zeros.